# Services
Latency percentiles, error rate, throughput, and Apdex for every service that sends traces, with a detail page per service for its endpoints, operations, and dependencies.
The **Services** page lists every service that sent spans in the selected time range, with latency percentiles, error rate, and throughput. Open a service to see its charts over time, its HTTP endpoints, its operations, the services and databases it calls, and its open error issues.
## What data it needs
Services are built from traces. Each distinct `service.name` resource attribute is one service. The metrics come from entry spans: root spans and spans with kind `Server` or `Consumer`.
- **Error rate** counts spans with status `Error`.
- **Environment** and **Namespace** read `deployment.environment` and `service.namespace`.
- **Commit SHA** and **Last deploy** read `vcs.ref.head.revision`.
See [OpenTelemetry conventions](/docs/concepts/otel-conventions#service-identity) for these attributes.
## The services list
The default time range is the last 12 hours.
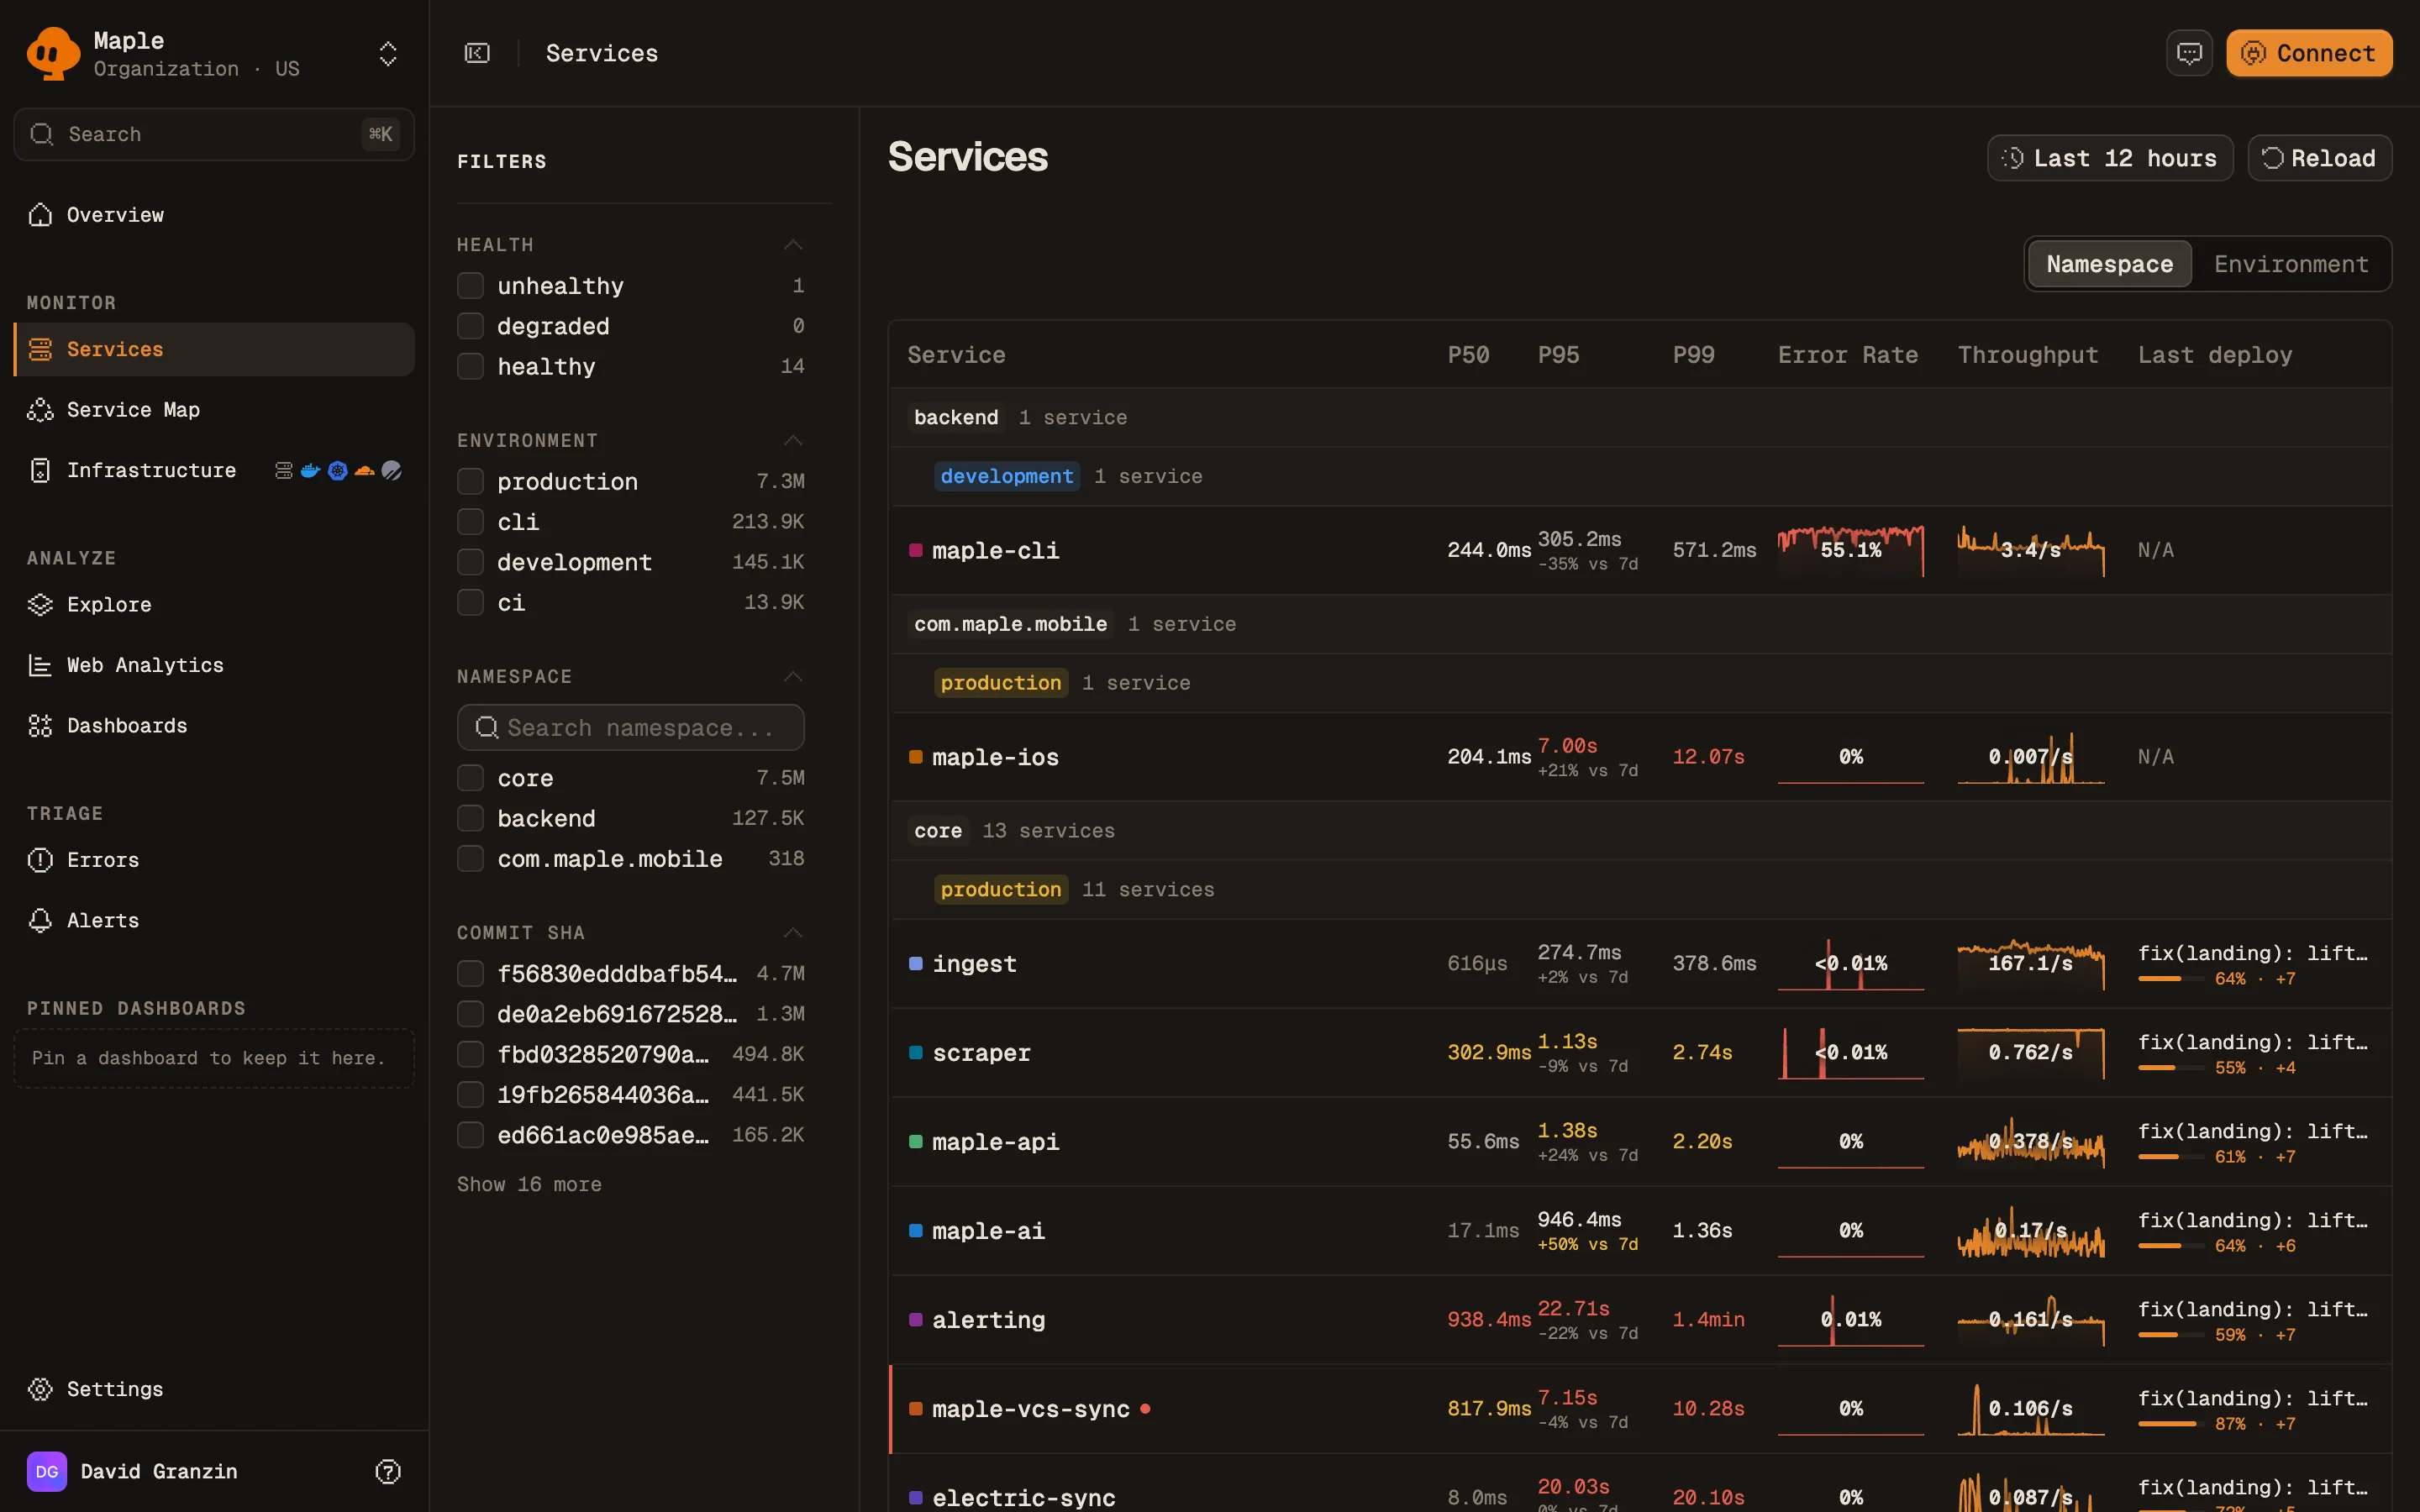
The table has these columns: **Service**, **P50**, **P95**, **P99**, **Error Rate**, **Throughput**, and **Last deploy**. **Error Rate** and **Throughput** include a sparkline. Rows are grouped by environment, or by namespace when your services set one. Switch grouping with **Group services by**.
Services grouped by namespace and environment, each with latency percentiles, error rate, throughput and last deploy.
A colored dot marks a service as degraded or unhealthy. Health comes from open alert incidents (**Alert firing**) and anomalies (**Anomaly**) on that service. A critical cause makes a service unhealthy. Any other cause makes it degraded. The footer counts services and how many are unhealthy or degraded.
### Filters
The sidebar filters by **Health**, **Environment**, **Namespace**, and **Commit SHA**. Each filter can include or exclude a value.
Click a row to open the service, scoped to that row's environment.
## Service detail
The header has an environment switcher (**All environments** or one environment) and a **Create Alert** button. The page has four tabs.
### Overview
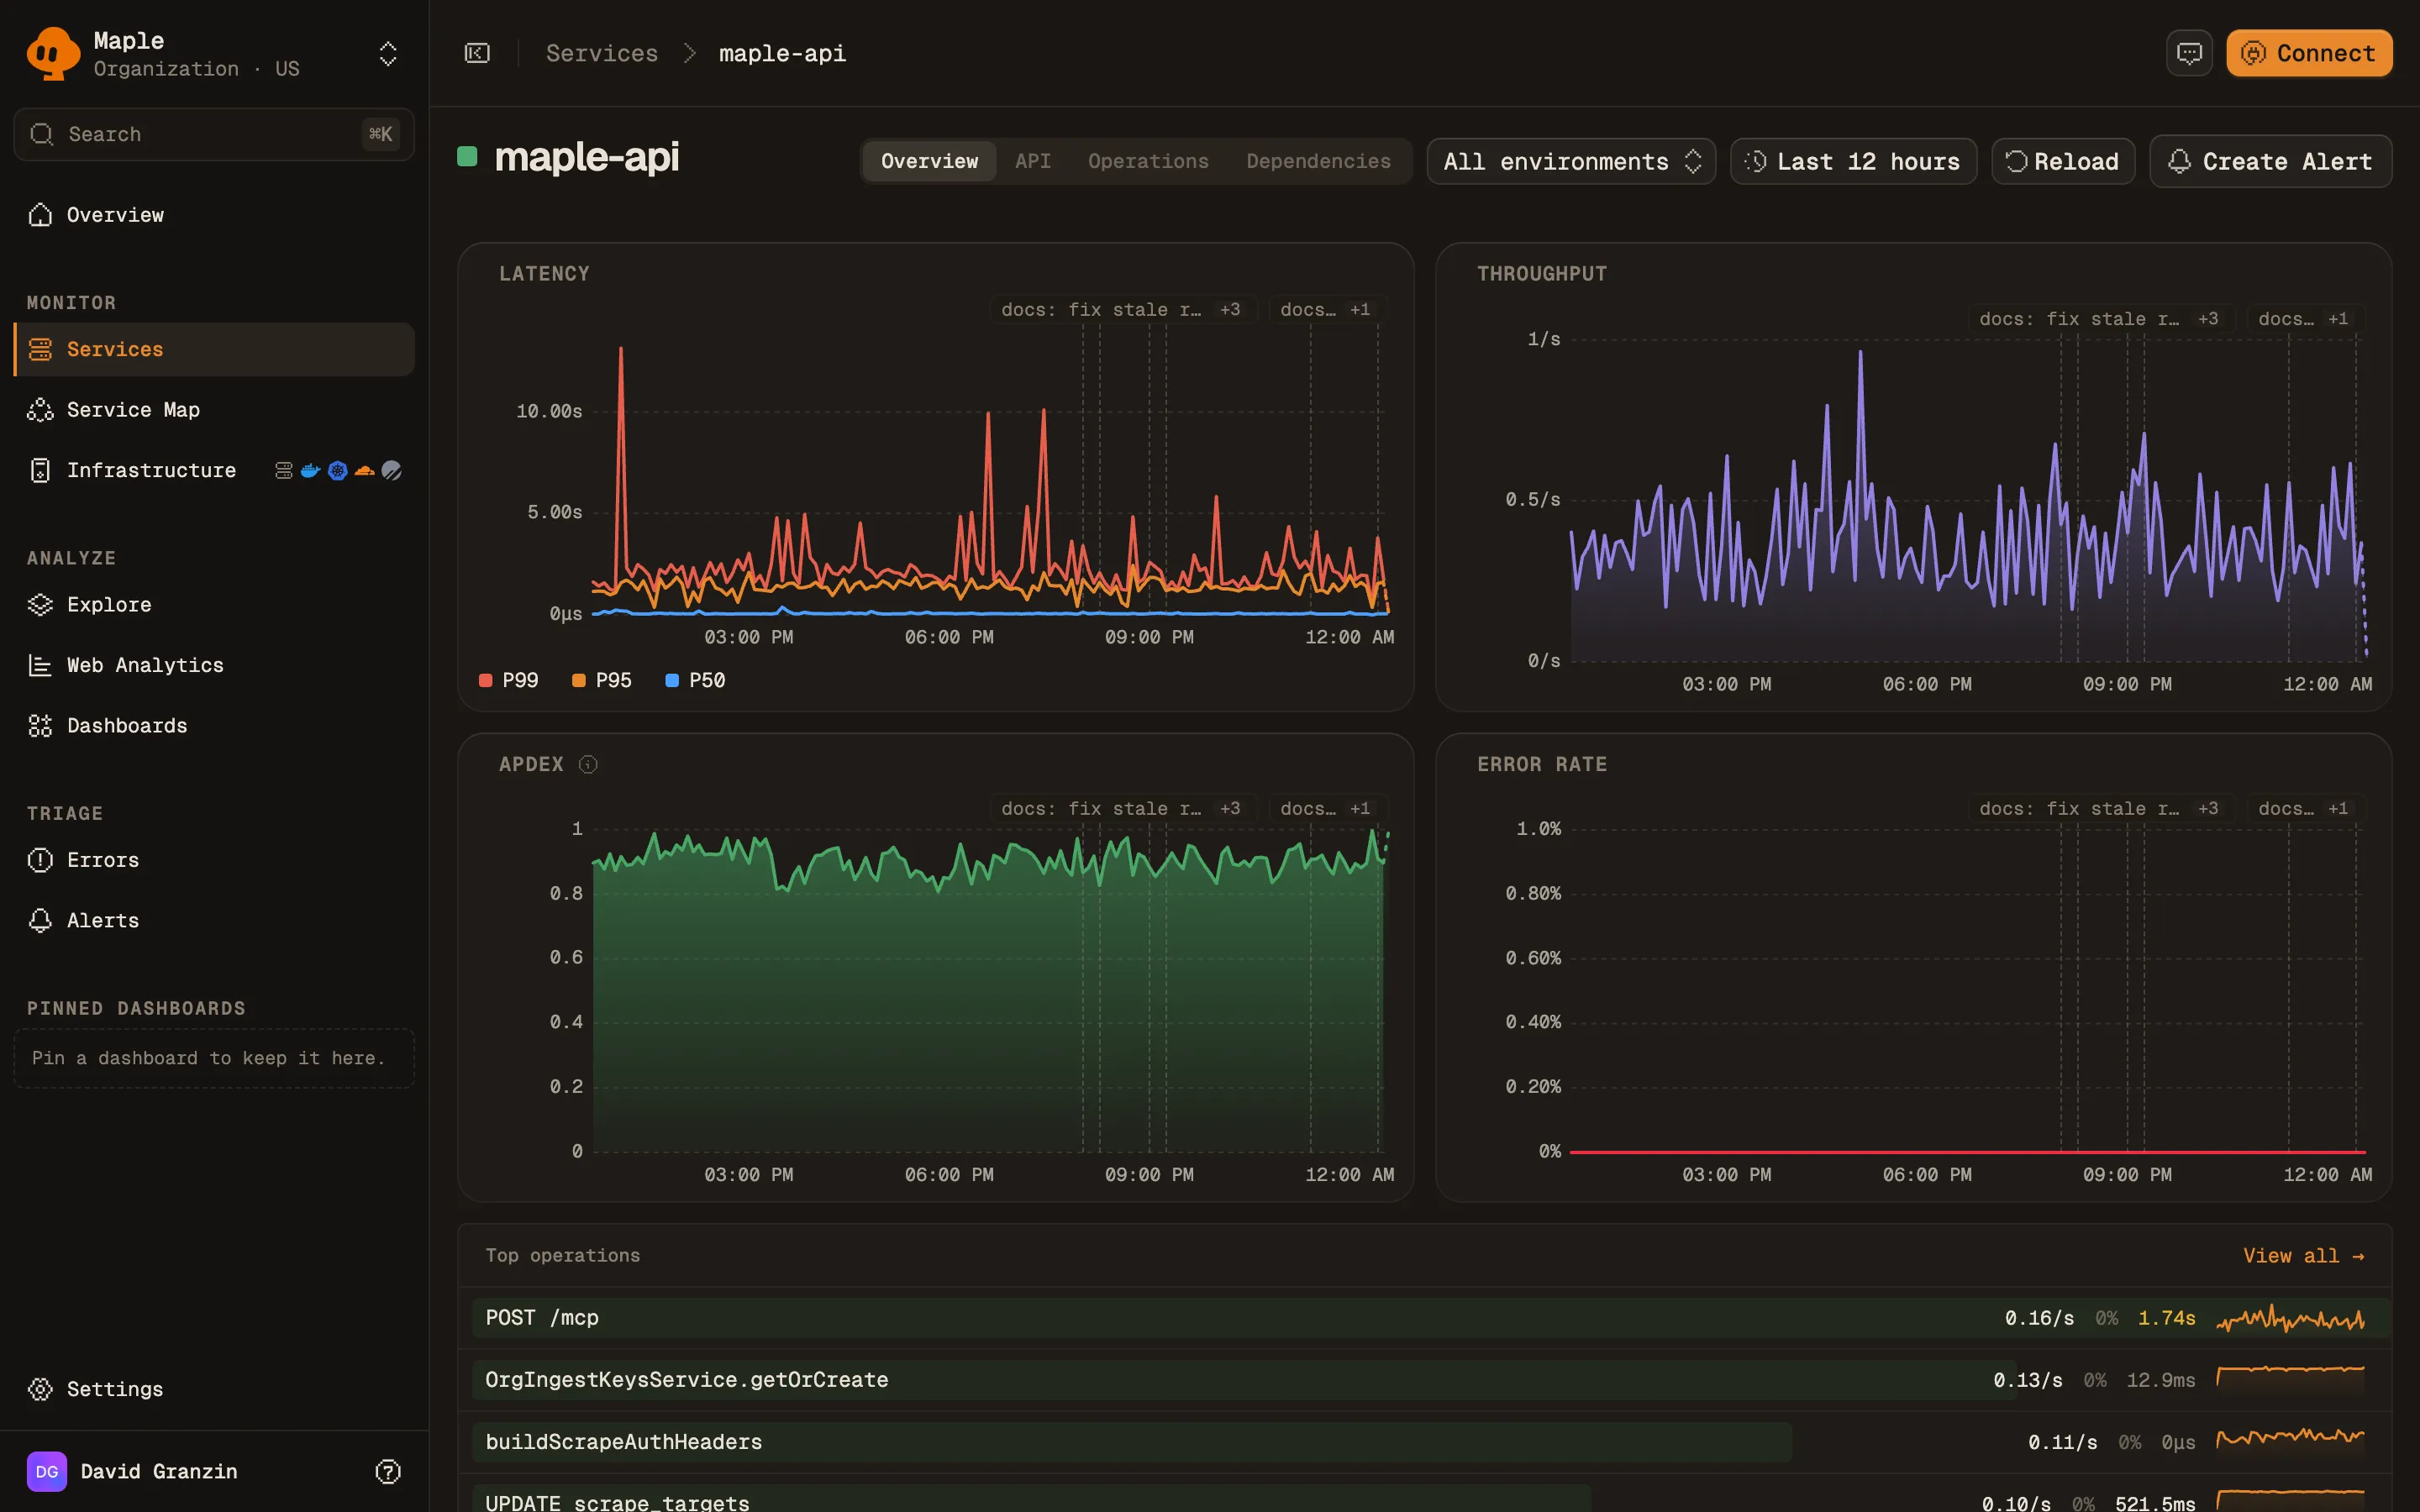
Four charts: **Latency**, **Throughput** (requests per second), **Apdex**, and **Error Rate**. Deploys appear as commit markers on every chart.
A service's Overview tab. The dashed markers on each chart are deploys.
**Apdex** scores requests from 0 to 1 against a 500 ms target (T):
- Satisfied: no error and duration under T.
- Tolerating: no error and duration from T up to 4T.
- Frustrated: slower than 4T, or an error.
Apdex = (satisfied + 0.5 × tolerating) / total. See [Apdex alerts](/docs/alerting/apdex-alerts) to alert on it.
Panels below the charts:
- **Top operations**, with **View all** to open the **Operations** tab.
- **Open issues**: [error issues](/docs/errors/overview) for this service from the latest 90 days.
- **Recent deploys**.
- **Ingest this window**: logs, spans, and metrics this service sent in the time range.
- **Kubernetes**: workloads running the service, with CPU and memory, when Kubernetes resource attributes are present.
- **Talks to**: the services and databases it calls.
### API
HTTP endpoints served by this service, with **Req/s**, **Errors**, **p50**, **p95**, and **p99**. Summary stats show the endpoint count, total requests per second, errors, and the worst p99. Requests that did not match a route are split into **Unrouted paths** and **Scanner probes**, hidden until you click **Show anyway**. Click an endpoint to open matching traces.
### Operations
Every span name the service handles, with **Calls /s**, **Errors**, **p50**, and **p95**. Click a row to open matching traces.
### Dependencies
Everything this service calls, with **Calls /s**, **Errors**, and **p95**. Each row has a type badge: **Service**, **Database**, **HTTP**, **Queue**, or **RPC**. The header highlights the **Busiest**, **Most errors**, and **Slowest p95** dependency. Click a row to open the traces for those calls.
Dependencies come from spans with kind `Client` or `Producer`. See [Service map](/docs/explore/service-map) for how Maple identifies the target of a call.
## Query services from an assistant
The [MCP server](/docs/reference/mcp) exposes the same data:
- `list_services`: throughput, error rate, and P95 per service, filterable by environment.
- `diagnose_service`: health metrics, Apdex, top errors, and recent traces and logs for one service.
- `get_service_top_operations`: a service's operations ranked by a chosen metric (call count by default).
## Troubleshooting
- **"No services yet".** Maple has never received a span. Services come from traces, so set up an OpenTelemetry SDK first. See [Instrumentation](/docs/instrumentation).
- **"No services in this time range".** Maple has traces, just not in this window. Widen the range.
- **"No services match these filters".** Your filters excluded everything. Clear them.
- **A service is missing.** Only services with entry spans (root, `Server`, or `Consumer`) get a row. A service that only emits `Client`, `Producer`, or `Internal` spans with a parent does not.
- **A service appears under the wrong name.** Set `service.name` explicitly in your SDK. Without it, many SDKs report `unknown_service`.
- **"No HTTP endpoints in this window" on the API tab.** An endpoint needs a `Server` span that carries a route. Most HTTP framework instrumentations set `http.route`. See [HTTP attributes](/docs/concepts/otel-conventions#http-attributes).
## Next steps
- [Service map](/docs/explore/service-map): how services and databases connect.
- [Traces](/docs/explore/traces): the requests behind each number.
- [Apdex alerts](/docs/alerting/apdex-alerts): alert when user-facing latency degrades.