Embed dashboard charts in your own product
Put a live Maple chart in your admin panel, internal tool or customer-facing page with a plain iframe. Make the dashboard public, copy the chart's embed snippet, and set theme, time range, refresh and variables in the URL.
Any chart on a public Maple dashboard can go into another page as a plain <iframe>. The chart queries Maple every time it loads, so the page shows the same numbers as the dashboard, with no export job and no second copy of the data.
The example on this page is Fieldnote, a made-up B2B app. Its admin panel has a Growth page, and its three funnel charts are embedded from Maple.
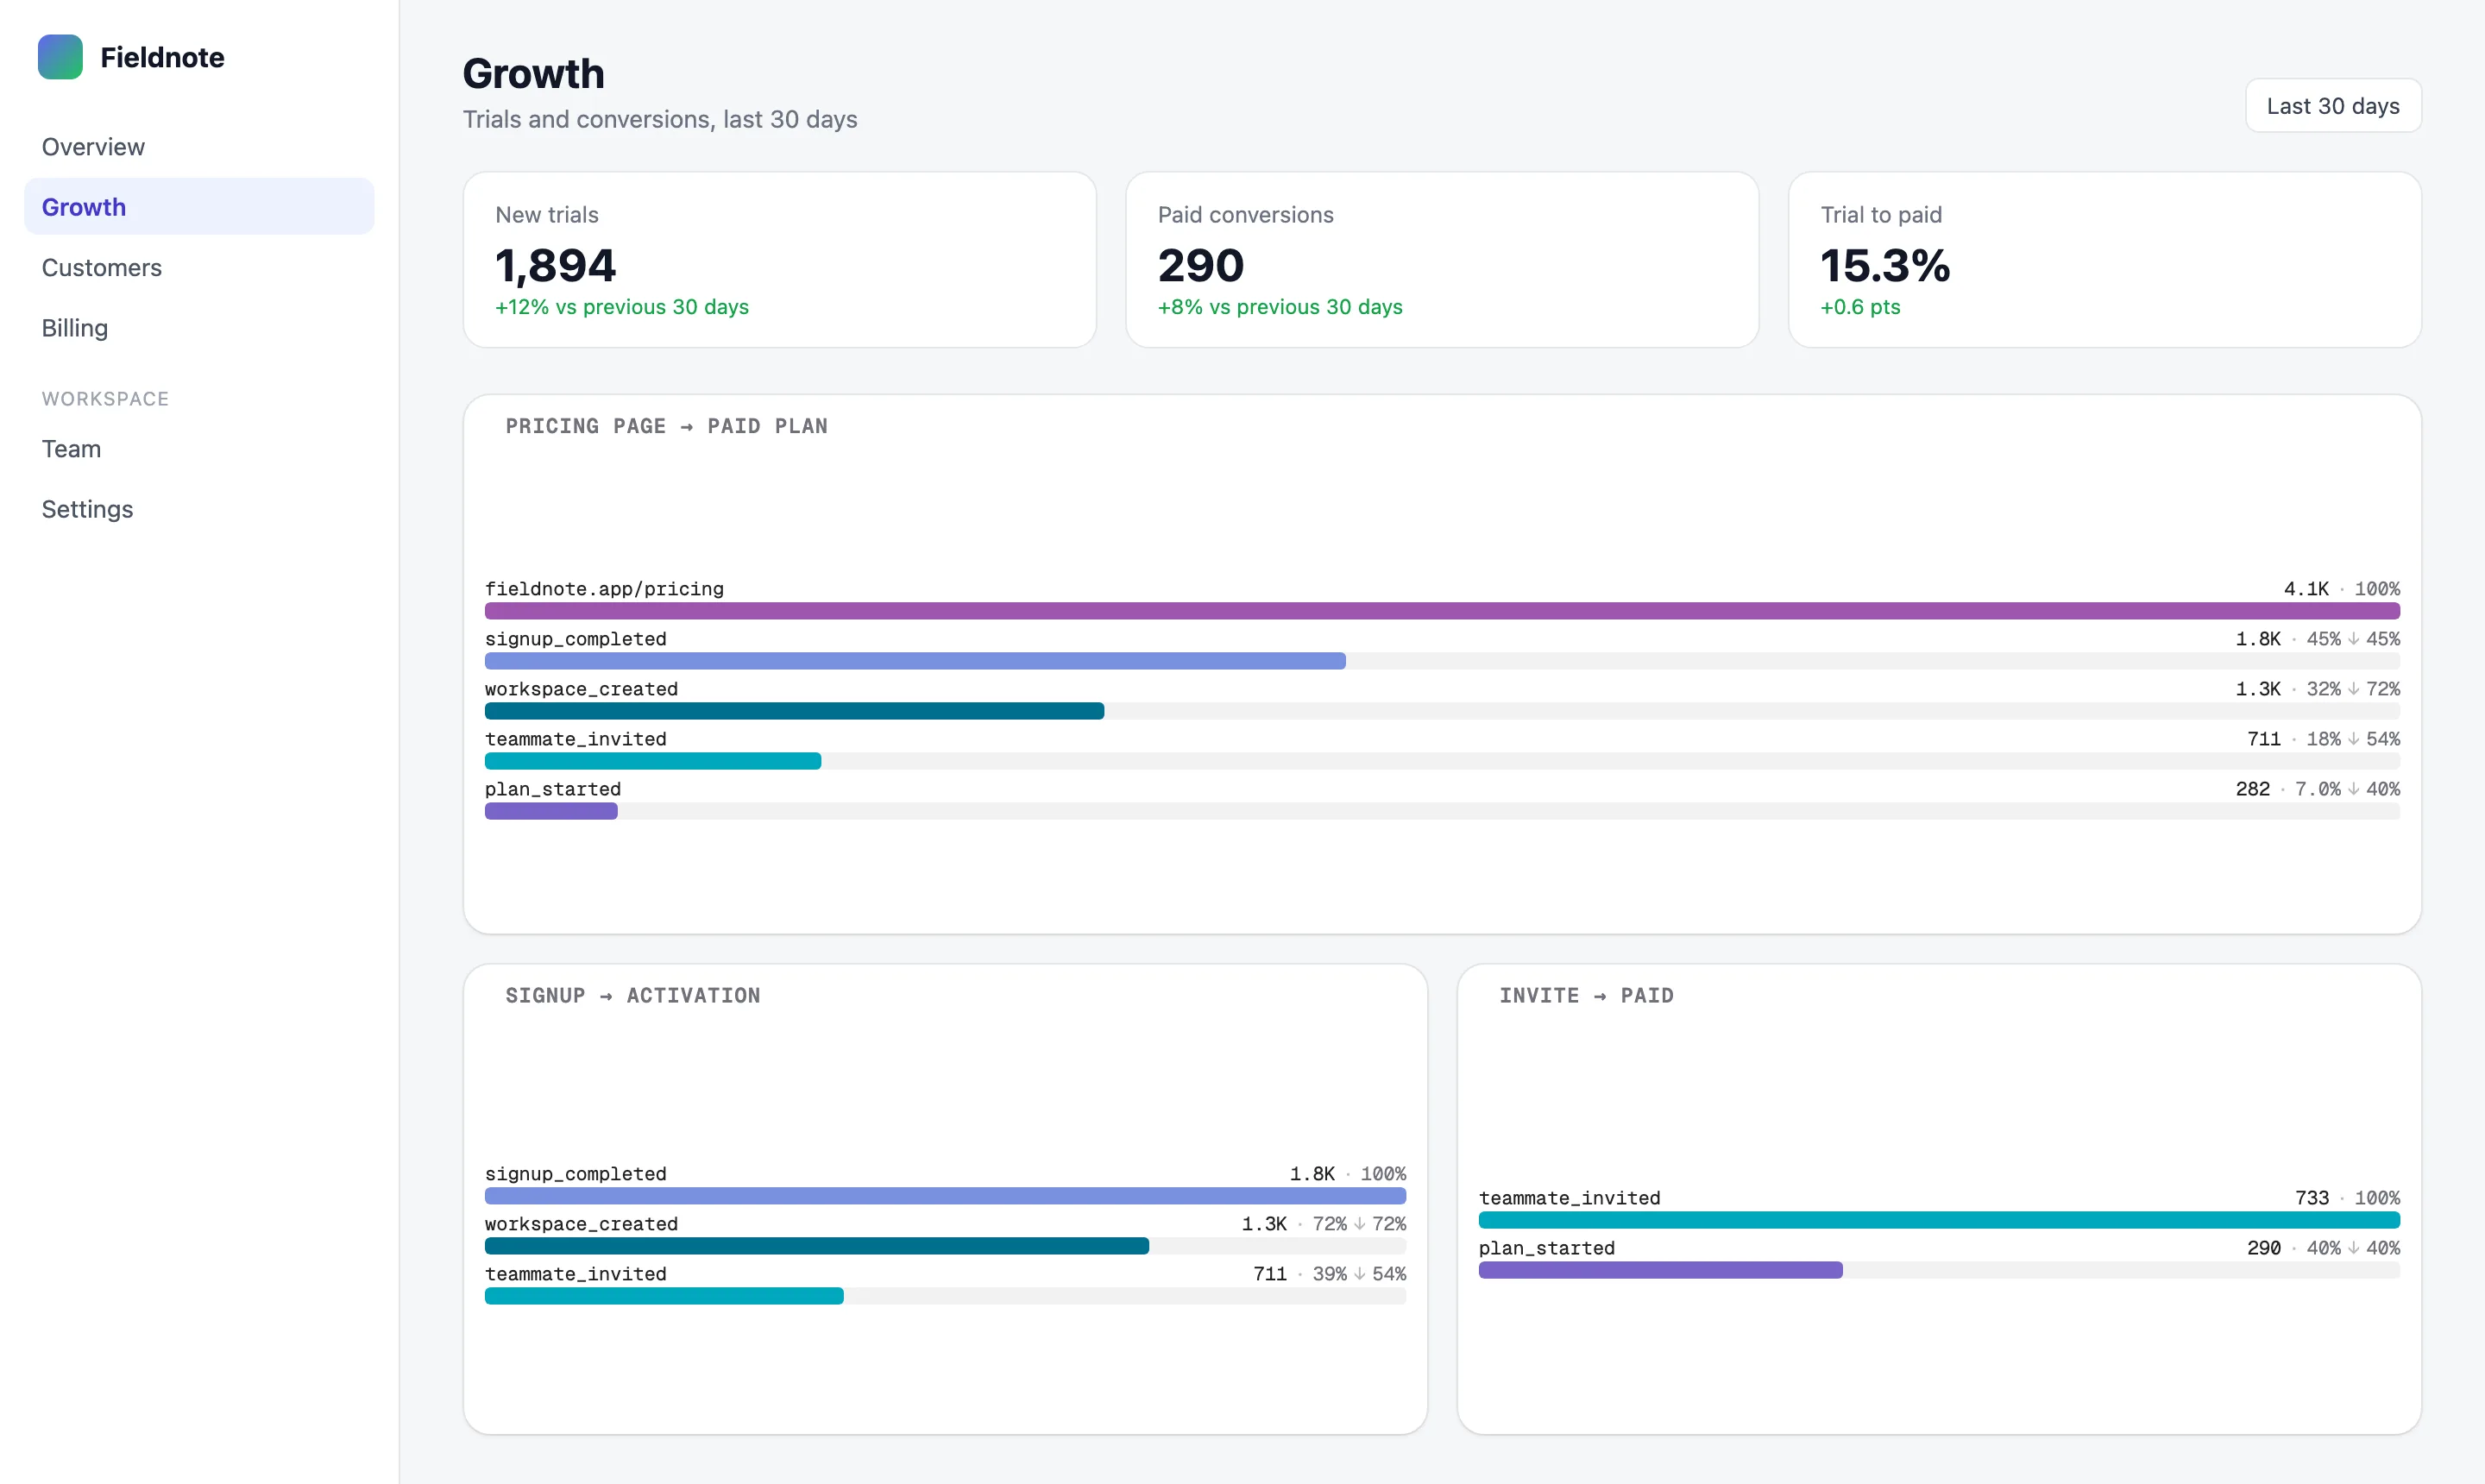
theme=light.The charts come from a Maple dashboard called Customer funnel:
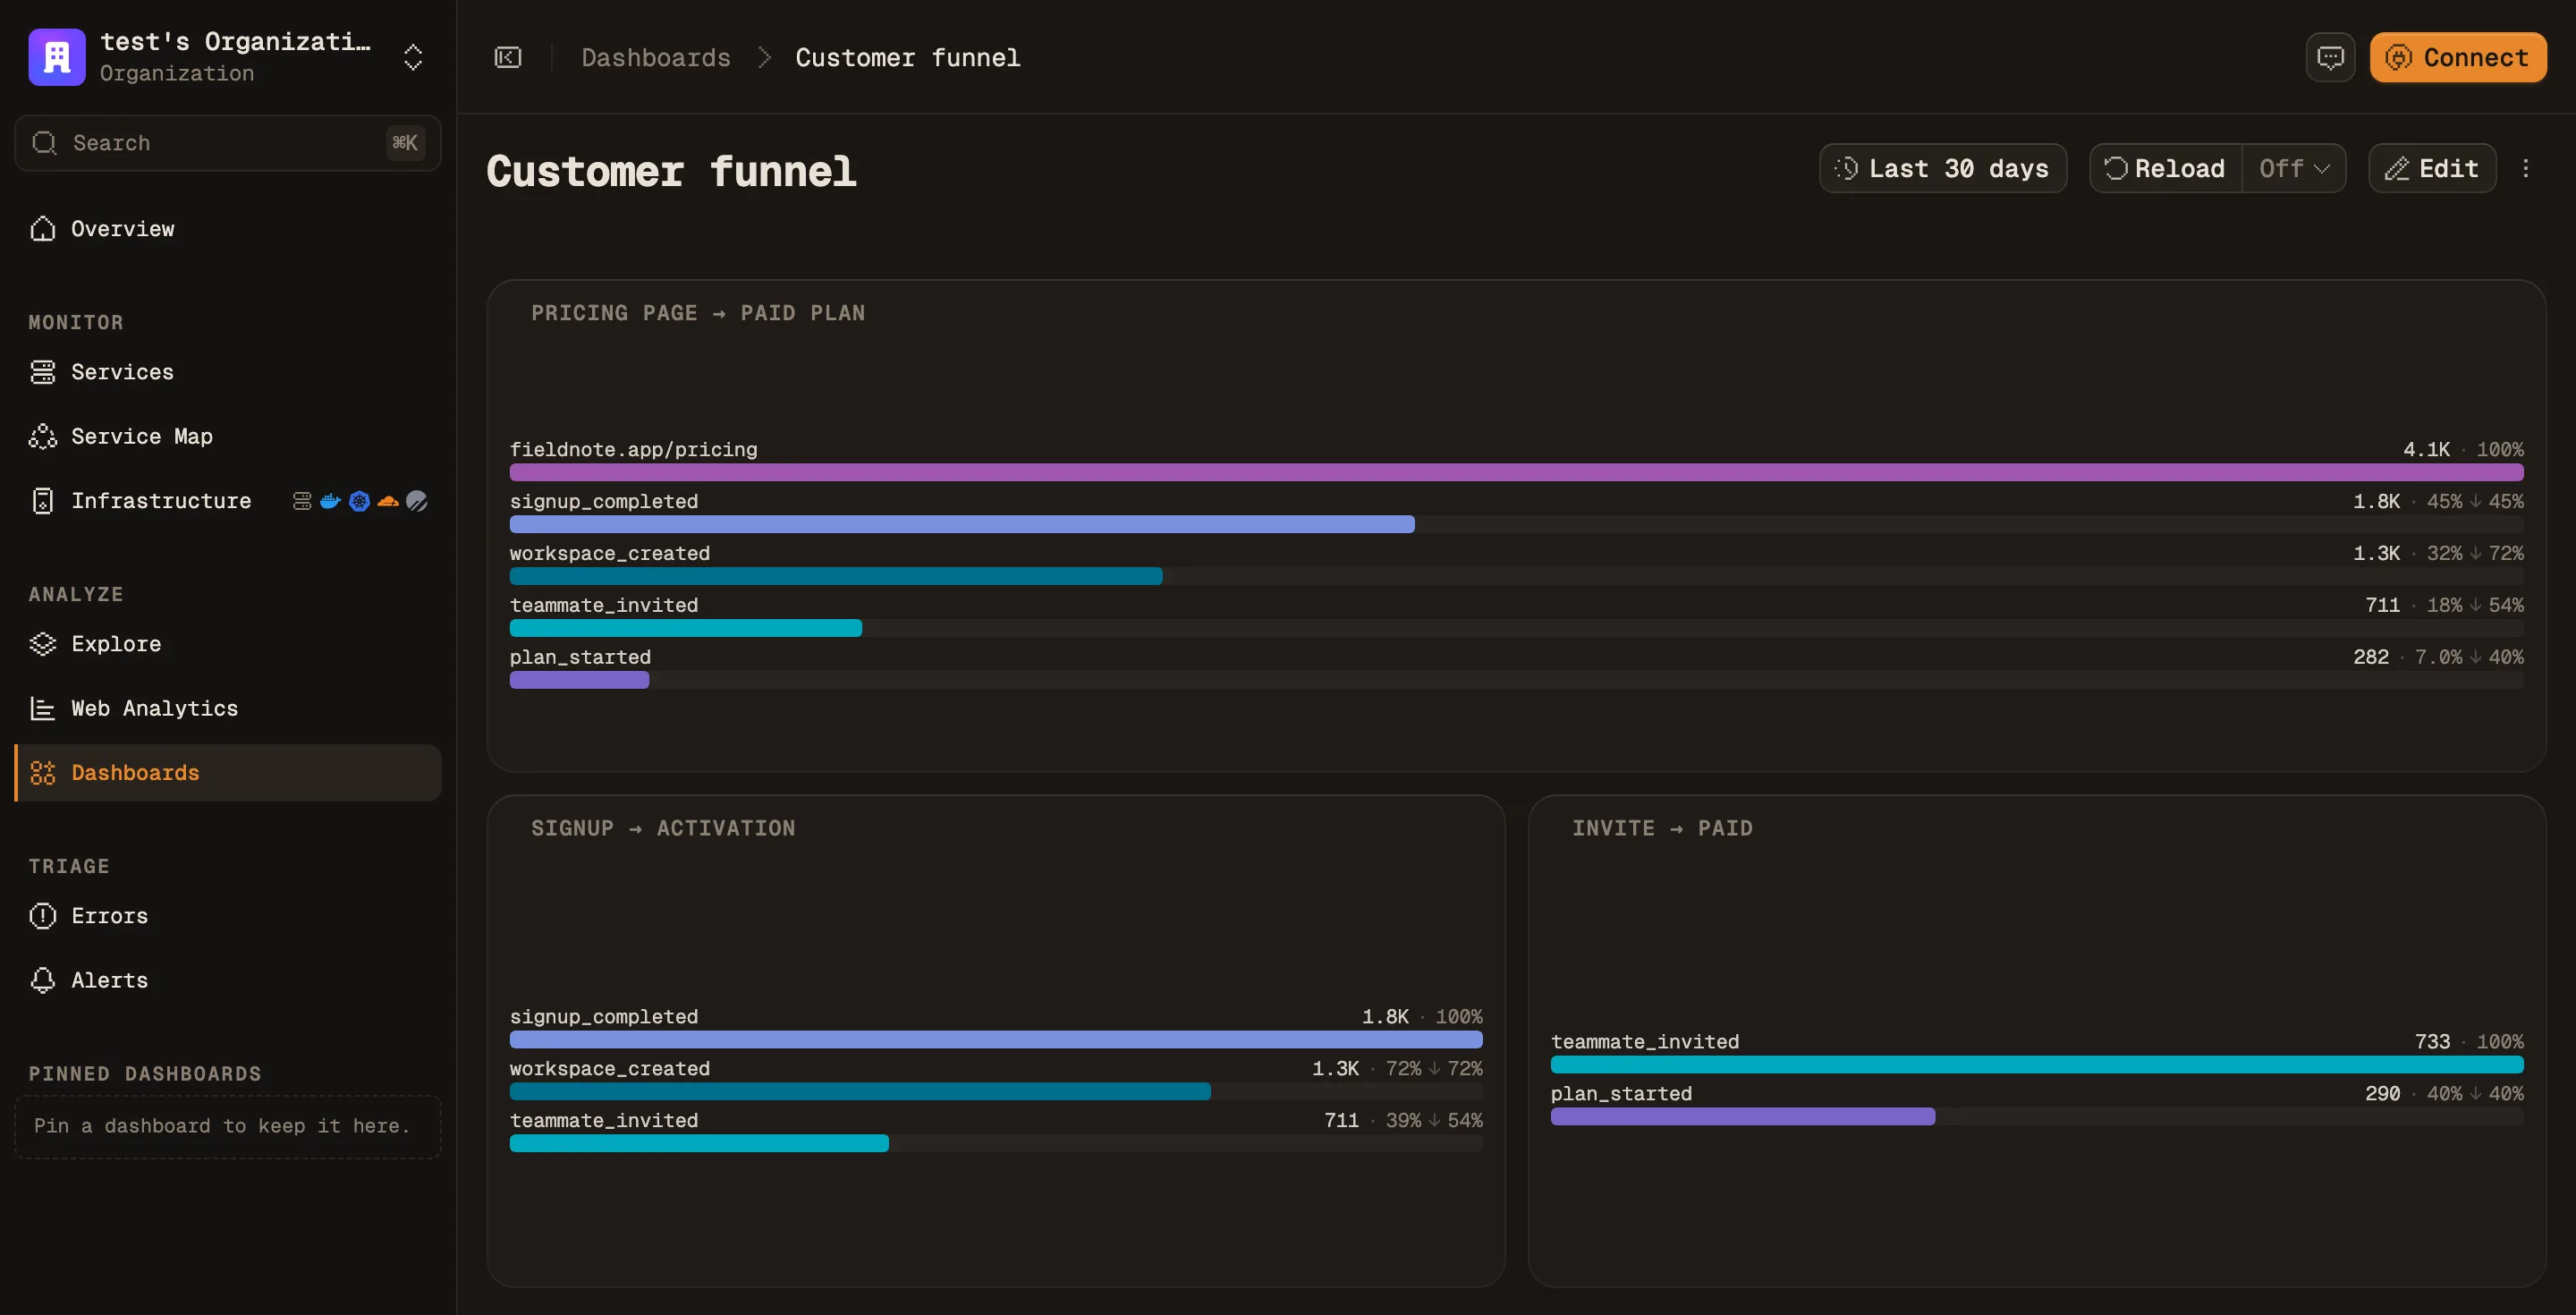
Other chart types embed the same way. See Which charts can be embedded.
Embed a chart in three steps
Step 1: make the dashboard public
A chart can only be embedded while its dashboard is shared with Anyone with the link. Open the ⋮ menu in the dashboard header, choose Share…, and pick that option.
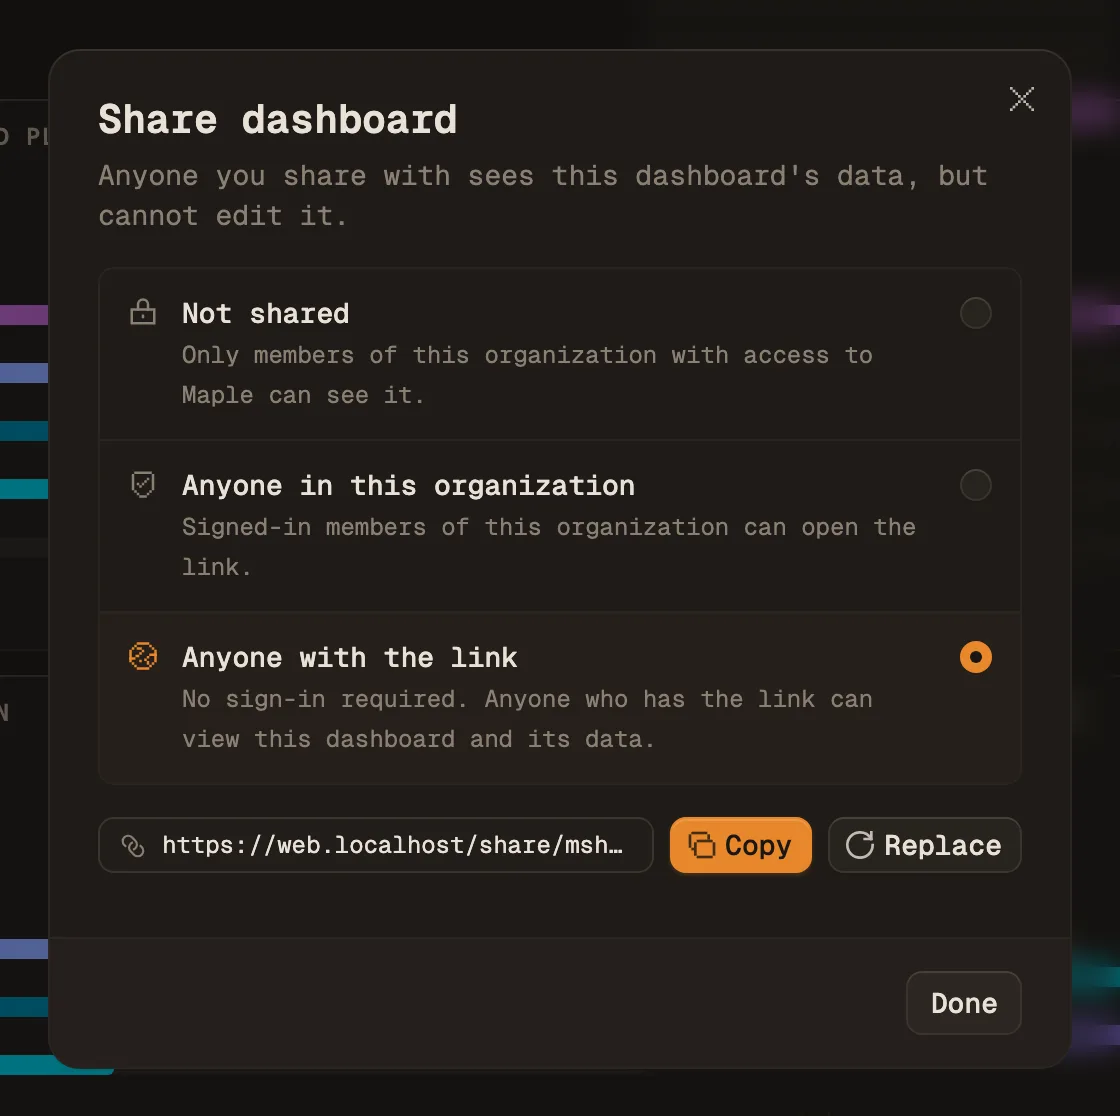
This makes the whole dashboard viewable, without signing in, by anyone who has the dashboard’s own link. If some charts on a dashboard should stay private, move the charts you want to embed to a dashboard of their own.
Step 2: open Embed chart
Hover the chart, open its ⋮ menu and choose Embed chart.
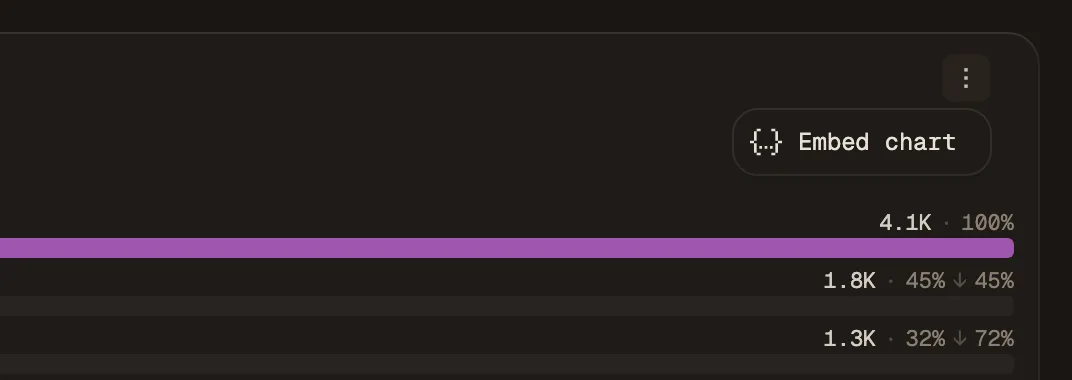
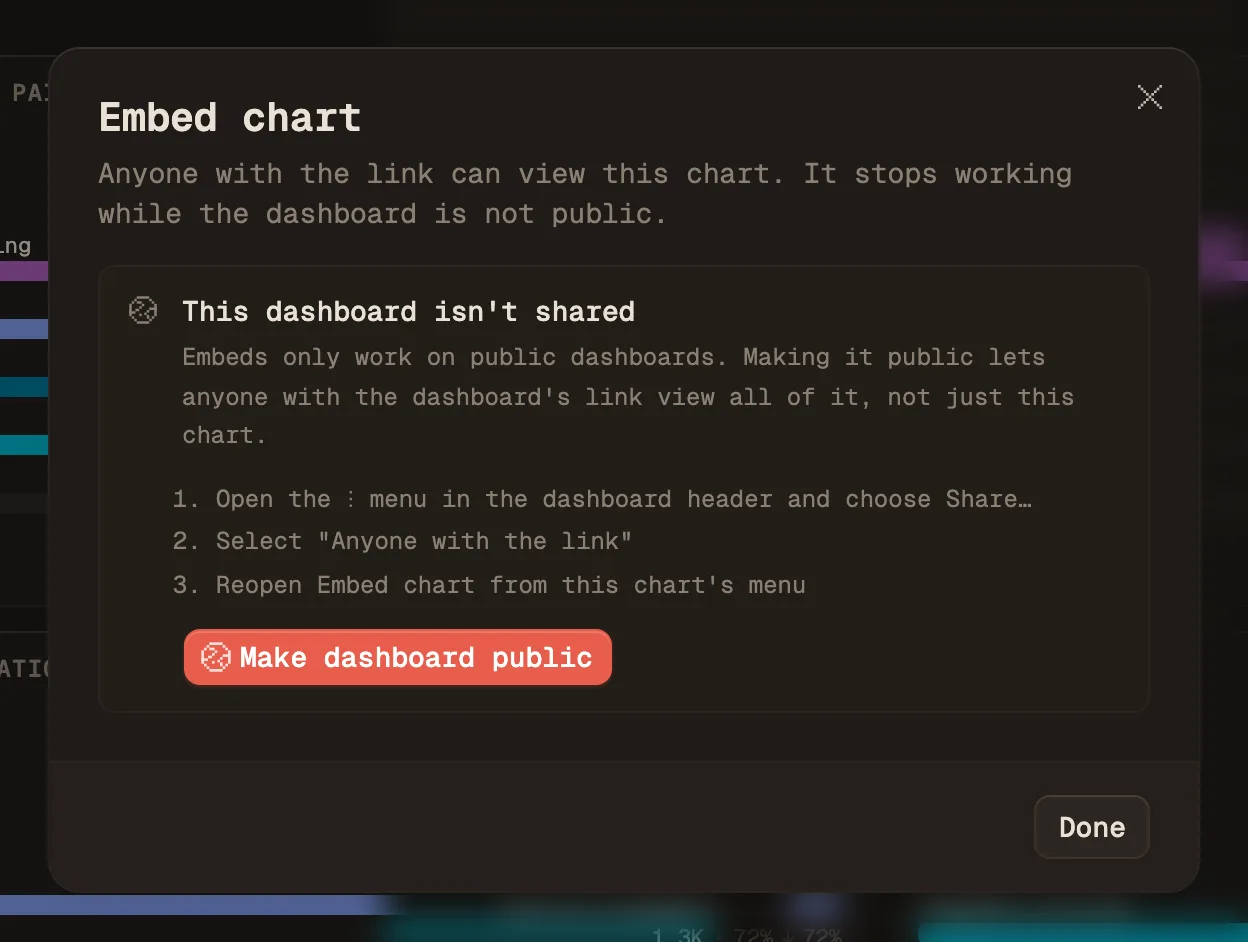
If the dashboard isn’t public yet, the dialog says so and offers to make it public for you. That button does exactly what Step 1 does.
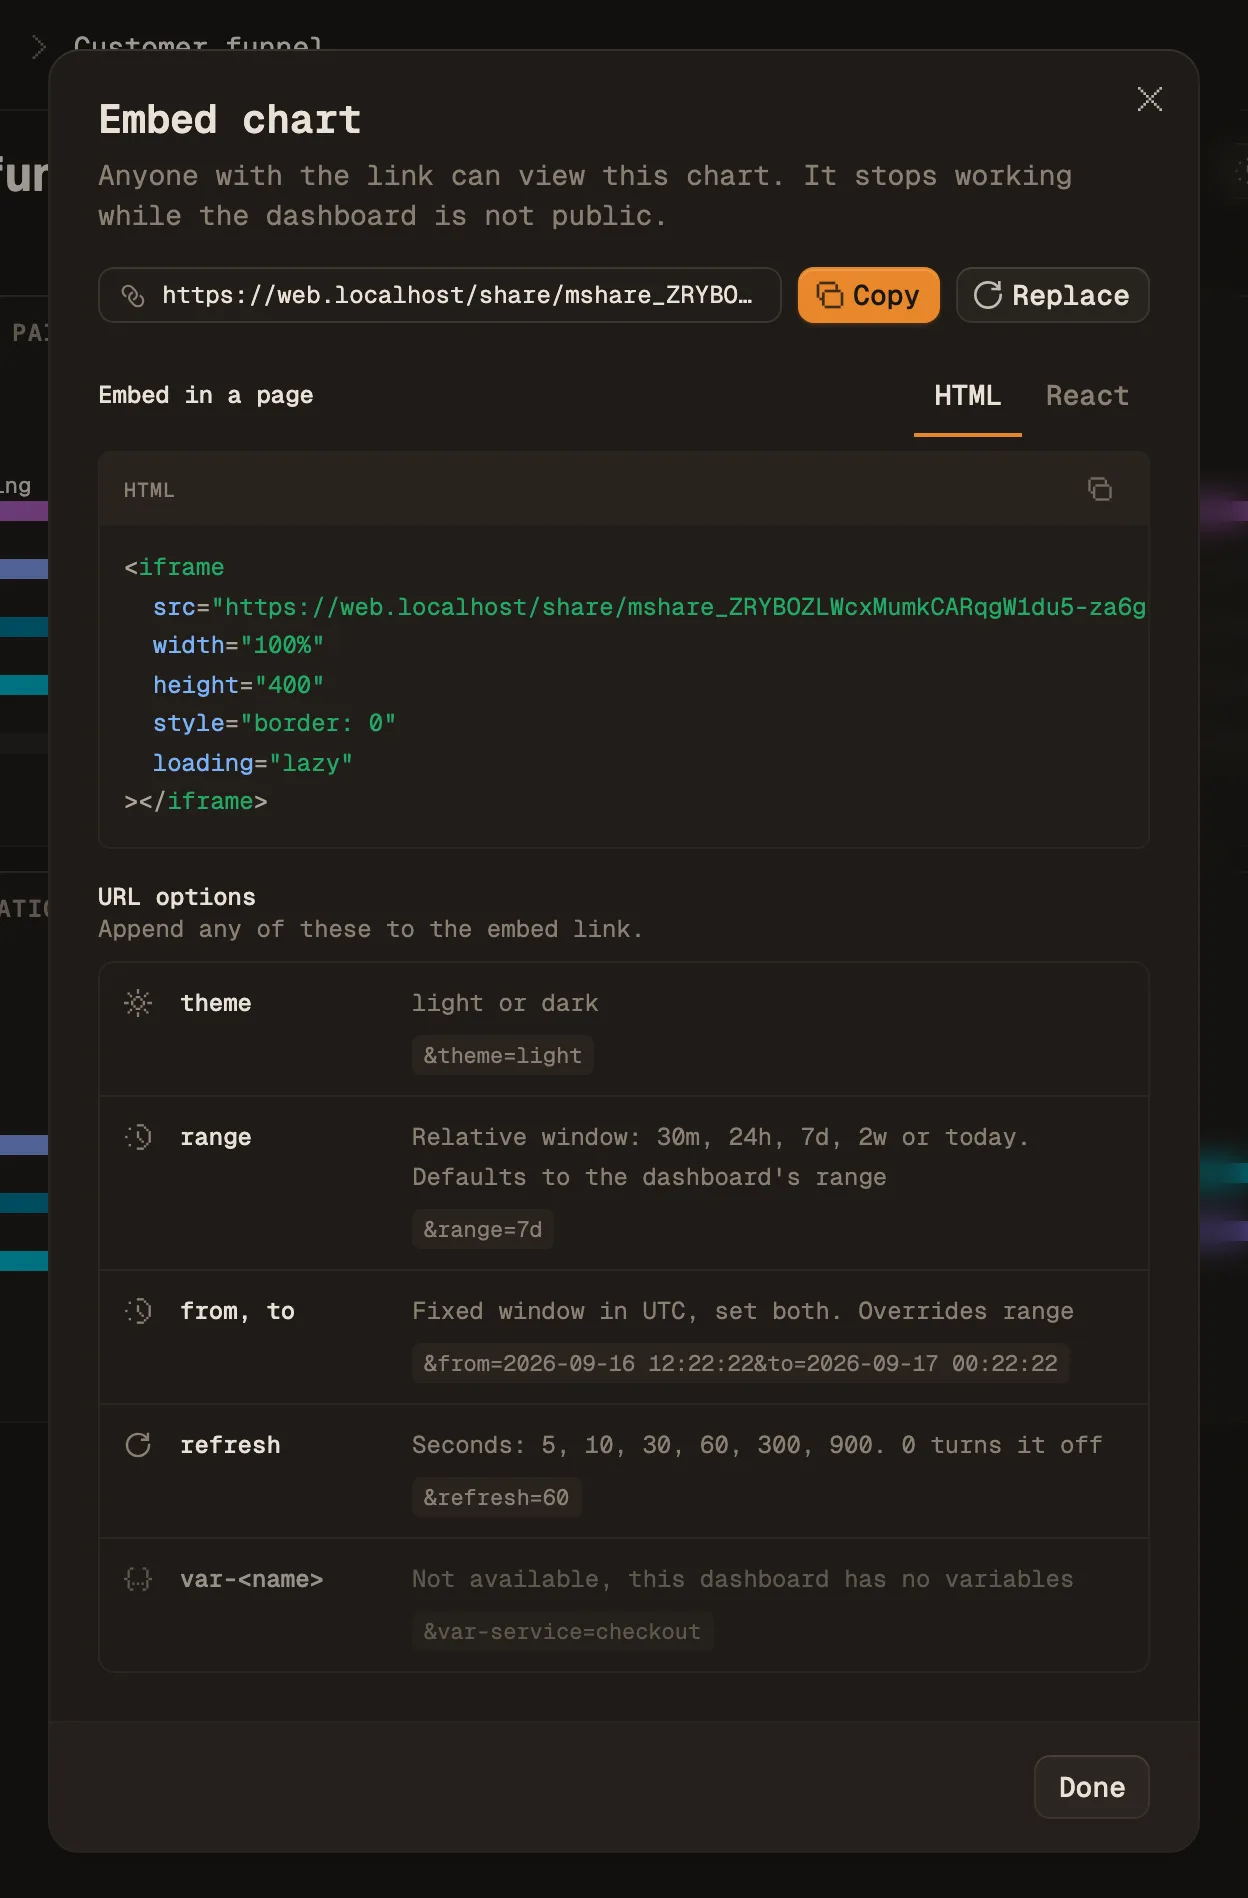
On a public dashboard, the dialog creates the chart’s own link the first time you open it and shows it with a ready-to-paste snippet.
Step 3: paste the snippet into your page
Copy the snippet from the HTML tab for plain HTML, Vue, Svelte, Angular or a server-rendered template:
<iframe
	src="https://app.maple.dev/share/<token>?embed=true"
	width="100%"
	height="400"
	style="border: 0"
	loading="lazy"
></iframe>
Use the React tab in JSX. React only accepts style as an object, so the HTML version fails to compile there:
<iframe
	src="https://app.maple.dev/share/<token>?embed=true"
	width="100%"
	height={400}
	style={{ border: 0 }}
	loading="lazy"
/>
The chart fills the frame, so height sets the chart’s height. ?embed=true removes Maple’s page header, and the embed has no background of its own: the chart’s card sits directly on your page, as in the Fieldnote screenshot. The card has 8px of space around it inside the frame, so pull the iframe out by 8px if its edges need to line up with your own cards.
Set theme, time range, refresh and variables in the URL
Append any of these to the link in src:
| Parameter | Values |
|---|---|
theme | light or dark. Without it, the embed uses the theme the viewer last chose in Maple, and dark for a viewer who has never opened Maple. |
range | A relative window: minutes, hours, days, weeks or months, such as 30m, 24h, 7d, 2w or 1mo, or today. Up to 31 days. Defaults to the dashboard’s own time range. |
from, to | A fixed window in UTC, YYYY-MM-DD HH:MM:SS. Set both. Takes precedence over range. |
refresh | Seconds between reloads: 5, 10, 30, 60, 300 or 900. 0 turns it off. Defaults to the dashboard’s own setting. |
var-<name> | A value for one of the dashboard’s variables, such as var-service=checkout. |
The dialog lists the dashboard’s own variables with an example value for each. A space in from and to works as typed inside an HTML attribute.
For example, a light chart over the last 7 days that reloads every five minutes:
<iframe
	src="https://app.maple.dev/share/<token>?embed=true&theme=light&range=7d&refresh=300"
	width="100%"
	height="330"
	style="border: 0"
	loading="lazy"
></iframe>
A relative window, from range or from the dashboard, is recalculated on every load and refresh, so the chart always ends at the current time. A range the chart can’t read is ignored and the dashboard’s range is used instead.
What a viewer of the embed can see
- This chart and nothing else. The chart’s link only returns data for that one chart. It can’t open the rest of the dashboard, and the chart’s query definition isn’t sent to the browser.
- Live data. Every load and every
refreshruns the chart’s query against your Maple data at that moment. - The chart as it is now. Edit the chart on the dashboard and the embed shows the change on its next load. Delete the chart and the embed shows “This link isn’t available”.
- No sign-in. Anyone who has the link can load it, the same as the dashboard’s own public link. Requests are rate-limited per link and per viewer IP.
Which charts can be embedded
Only charts on a dashboard. Pages such as Traces, Logs, Errors or the Service Map can’t be embedded; put the chart you need on a dashboard first.
On a dashboard, every chart you can add today can be embedded except Recent Traces. That covers query builder charts, raw SQL charts, markdown, funnels, paths and the service, error and log presets.
Older dashboards can hold charts built on data sources Maple no longer offers, such as trace facets or metric summaries. Those can’t be embedded either. For any chart that can’t be embedded, Embed chart is greyed out, and hovering it says why.
FAQ
How do I stop embedding a chart?
Pick the option that matches how permanent you want it to be:
- Turn off every embed on the dashboard, reversibly. Set the dashboard back to Not shared in its Share dialog. Every chart link on it stops working. Set it to Anyone with the link again and the same links, and the embeds using them, work again.
- Kill one chart’s link for good. Open Embed chart on that chart and click Replace. The old link never works again, and the dialog shows a new one. Anyone still embedding the chart needs the new link.
- Remove one chart’s link without replacing it via the API. Use a key that has
dashboards:write:
curl -X DELETE \
  -H "Authorization: Bearer $MAPLE_API_KEY" \
  https://api.maple.dev/v2/dashboards/<dashboard_id>/widgets/<widget_id>/share
Opening Embed chart on that chart later creates a new link.
Does replacing the dashboard’s share link break my embeds?
No. Replace in the Share dialog only replaces the dashboard’s own link. Chart embeds keep working as long as the dashboard stays public.
Why does my embed say “This link isn’t available”?
One of these happened: the dashboard is no longer shared, the chart’s link was replaced or removed, or the chart was deleted from the dashboard.
Can I embed a whole dashboard?
No. Only a single chart’s link can be shown inside another site. The dashboard’s own link shows “This link can’t be embedded” in an iframe; open it directly or link to it instead.
What if my dashboard is shared with “Anyone in this organization”?
Embeds don’t work, even for people who are signed in to Maple. A chart link is never more open than its dashboard, and embedding needs the dashboard to be public.
Do I need to change my Content Security Policy?
Only if your page sets frame-src (or child-src) in its Content-Security-Policy. Add https://app.maple.dev, or https://app.eu.maple.dev if your organization is in the EU region.
The chart is a JavaScript app, so it won’t render inside an iframe whose sandbox attribute leaves out allow-scripts. Some page builders add that restriction to embedded HTML.
Does the embed work when my app uses a light theme?
Add &theme=light to the link. Without theme, a viewer who has never opened Maple sees the dark theme, and a viewer who has sees the theme they last chose. Set theme explicitly so every viewer sees the same chart. The embed has no background, so the chart’s card sits on your page in either theme.