Logs
Search log messages by text or trace ID, filter by severity, service, and environment, and move between a log line and the trace it belongs to.
The Logs page shows the log records Maple received in the selected time range. A volume chart stacks log counts by severity. Below it, a table lists each record. Search by message text or trace ID, filter with the sidebar, and open any record to see its attributes and the trace it came from.
What data it needs
Logs arrive over OTLP, usually from an OpenTelemetry log bridge attached to your existing logger. Writing to stdout alone does not send anything to Maple. The page reads:
service.name,deployment.environment, andservice.namespaceresource attributes for the Service, Environment, and Namespace filters.- Severity text (for example
INFO,WARN,ERROR) for Severity and the chart colors. - Trace ID and span ID on the log record for trace correlation. OpenTelemetry log bridges set these automatically when a log is written inside an active span.
See OpenTelemetry conventions for severity levels and trace correlation.
The log list
The default time range is the last 12 hours. The chart at the top shows log volume by severity. Drag across it to zoom the time range to that window.
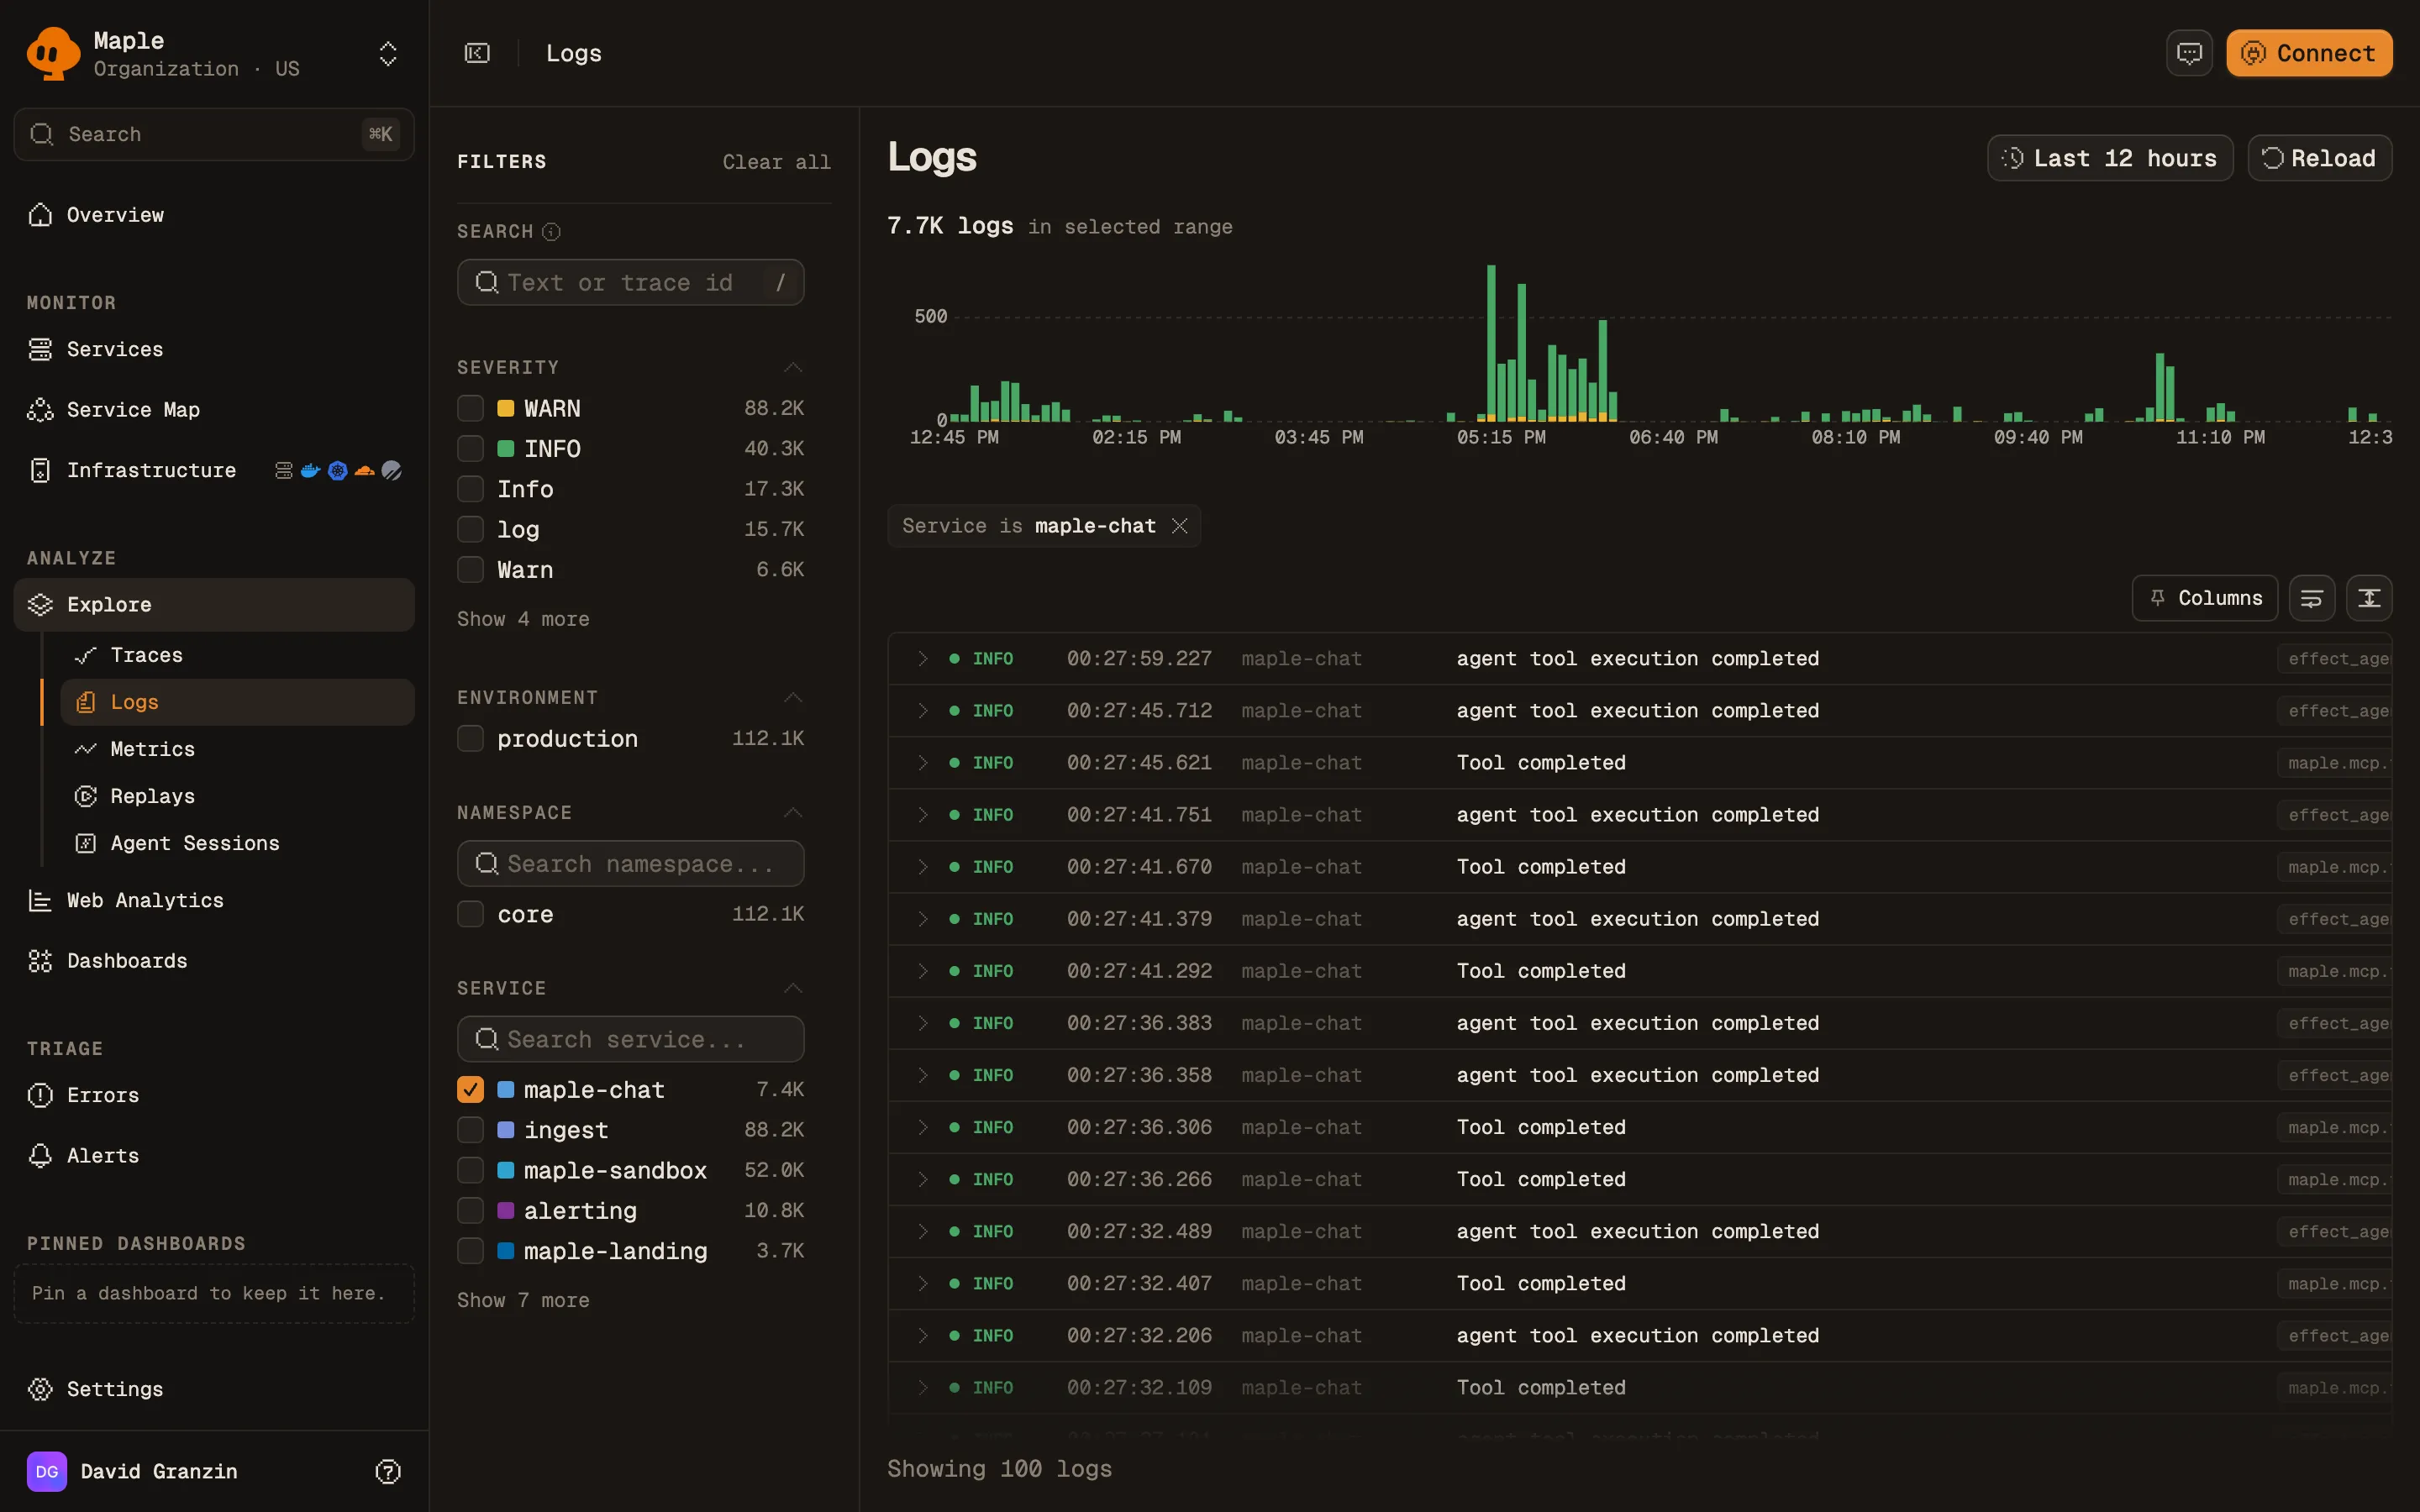
The table has Time, Service, and Message columns. The toolbar above it has three controls:
- Columns: pin attributes as extra columns. The picker lists attribute keys seen in the selected time range. Pinned columns are saved in the URL.
- Wrap long log lines.
- Toggle comfortable row density.
Click a row to expand it inline. Click Open detail to open the full record.
Search and filter
Search box
The Search box accepts three kinds of input:
| Input | What it does |
|---|---|
| Any text | Matches log messages containing the text, ignoring case. |
| A 32-character hex trace ID | Shows only logs from that trace. |
A W3C traceparent header value | Shows only logs from the trace it names. |
A trace ID becomes a removable chip. To search for a trace ID as plain text in messages, wrap it in double quotes. There is no key:value syntax. Use the sidebar to filter on fields.
Sidebar filters
| Filter | What it does |
|---|---|
| Severity | Filter by severity. Values come from your data, such as TRACE, DEBUG, INFO, WARN, ERROR, and FATAL. |
| Environment | Filter by deployment.environment. |
| Namespace | Filter by service.namespace. |
| Service | Filter by service.name. |
Each filter can include or exclude a value.
Log details
The detail sheet opens with the message, a meta strip, and an Error or Fatal banner for those severities. It has these tabs:
- Attributes: Log Attributes and Resource Attributes, with a Search attributes… box.
- Trace: a Trace Timeline of every log in the same trace (up to 200), with span boundaries marked. Shown when the log has a trace ID.
- Raw: the record as a JSON Payload.
- Infrastructure: host, container, or Kubernetes details, shown when the log carries those resource attributes.
The meta strip shows the timestamp, a trace: link, and the span ID. It also has Open in full page, Shareable link, and Log JSON (copy) actions.
Move between logs and traces
- From a log to its trace: click the
trace:link in the meta strip. The trace view opens at the log’s timestamp. - From a trace to its logs: on a trace, click View Logs, or open a span’s Logs tab. See Traces.
Query logs from an assistant
The MCP server exposes two log tools:
search_logs: filter by service, severity, message text, trace ID, or span ID.mine_log_patterns: groups recent matching log messages into templates such asGET /api/users/<*> 200 in <*>ms, with a count and a service and severity breakdown per template. It samples up to 50,000 recent logs (10,000 by default). Pattern mining is available through MCP only; the Logs page has no patterns view.
Troubleshooting
- “No logs yet”. Maple has never received a log record for this organization. Add an OpenTelemetry log bridge to your logger and export to the ingest endpoint. See Instrumentation.
- “No logs in this time range”. Maple has logs, just not in this window. Widen the time range.
- “No logs match these filters”. Your exclusions removed everything. Clear the filters.
- Logs have no
trace:link. The record has no trace ID. Emit the log inside an active span, with the OpenTelemetry log bridge installed, so the SDK attaches the IDs. - A trace-scoped search returns nothing. The trace’s logs may fall outside the selected time range. Widen it, or open the logs from the trace page, which sets the window for you.
Next steps
- Traces: inspect the requests your logs belong to.
- Errors and issues: how error spans become issues.
- Alert rules: alert on a query over your telemetry.