Service map
A live graph of your services and the databases they call, drawn from trace context, with call volume, error rate, and latency on every node and edge.
The Service Map draws your services and the databases they call as a graph. Maple builds it from your traces: an edge appears when one service calls another with trace context propagated, or when a service calls a database. Each node shows throughput, error rate, and latency. Each edge shows call volume and errors. Click a node to see its details.
What creates nodes and edges
Service to service
Maple draws an edge from service A to service B when a Client or Producer span in A has a child Server or Consumer span in B, in the same trace. Calls within one service do not draw an edge.
Both sides must be instrumented, and the caller must propagate trace context (the traceparent header) so the callee’s span becomes a child of the client span. Instrumented HTTP and RPC clients do this for you. peer.service does not create edges.
Service to database
A Client or Producer span with db.system.name (or the older db.system) creates a database node. Maple splits nodes by database name, taken from db.namespace, then db.name, then server.address, then net.peer.name. Services that call the same database share one node.
Database nodes are labeled by category from the db.system.name value:
| Category | Systems |
|---|---|
| Cache | redis, memcached, hazelcast |
| Queue | kafka, rabbitmq, pulsar, nats, activemq, sqs |
| Search | elasticsearch, opensearch, solr |
| Database | Everything else, such as postgresql, mysql, mongodb |
When the PlanetScale integration is connected, PlanetScale databases are marked on their nodes. Databases reached through Cloudflare Hyperdrive are grouped into one Hyperdrive node.
Calls the map does not draw
Outbound HTTP calls to hosts you do not instrument, and messaging or RPC calls without db.system.name, do not appear on the map. They appear on the Dependencies tab of the calling service, keyed by server.address, messaging.system, or rpc.system.
See OpenTelemetry conventions for the attributes to set.
Read the map
Service nodes show requests per second (req/s or calls/s), error percentage (err%), and average latency (avg). A badge shows the runtime platform, such as Kubernetes, Cloudflare Workers, AWS Lambda, or Web (browser). With Kubernetes infrastructure monitoring set up, nodes also show a pod count.
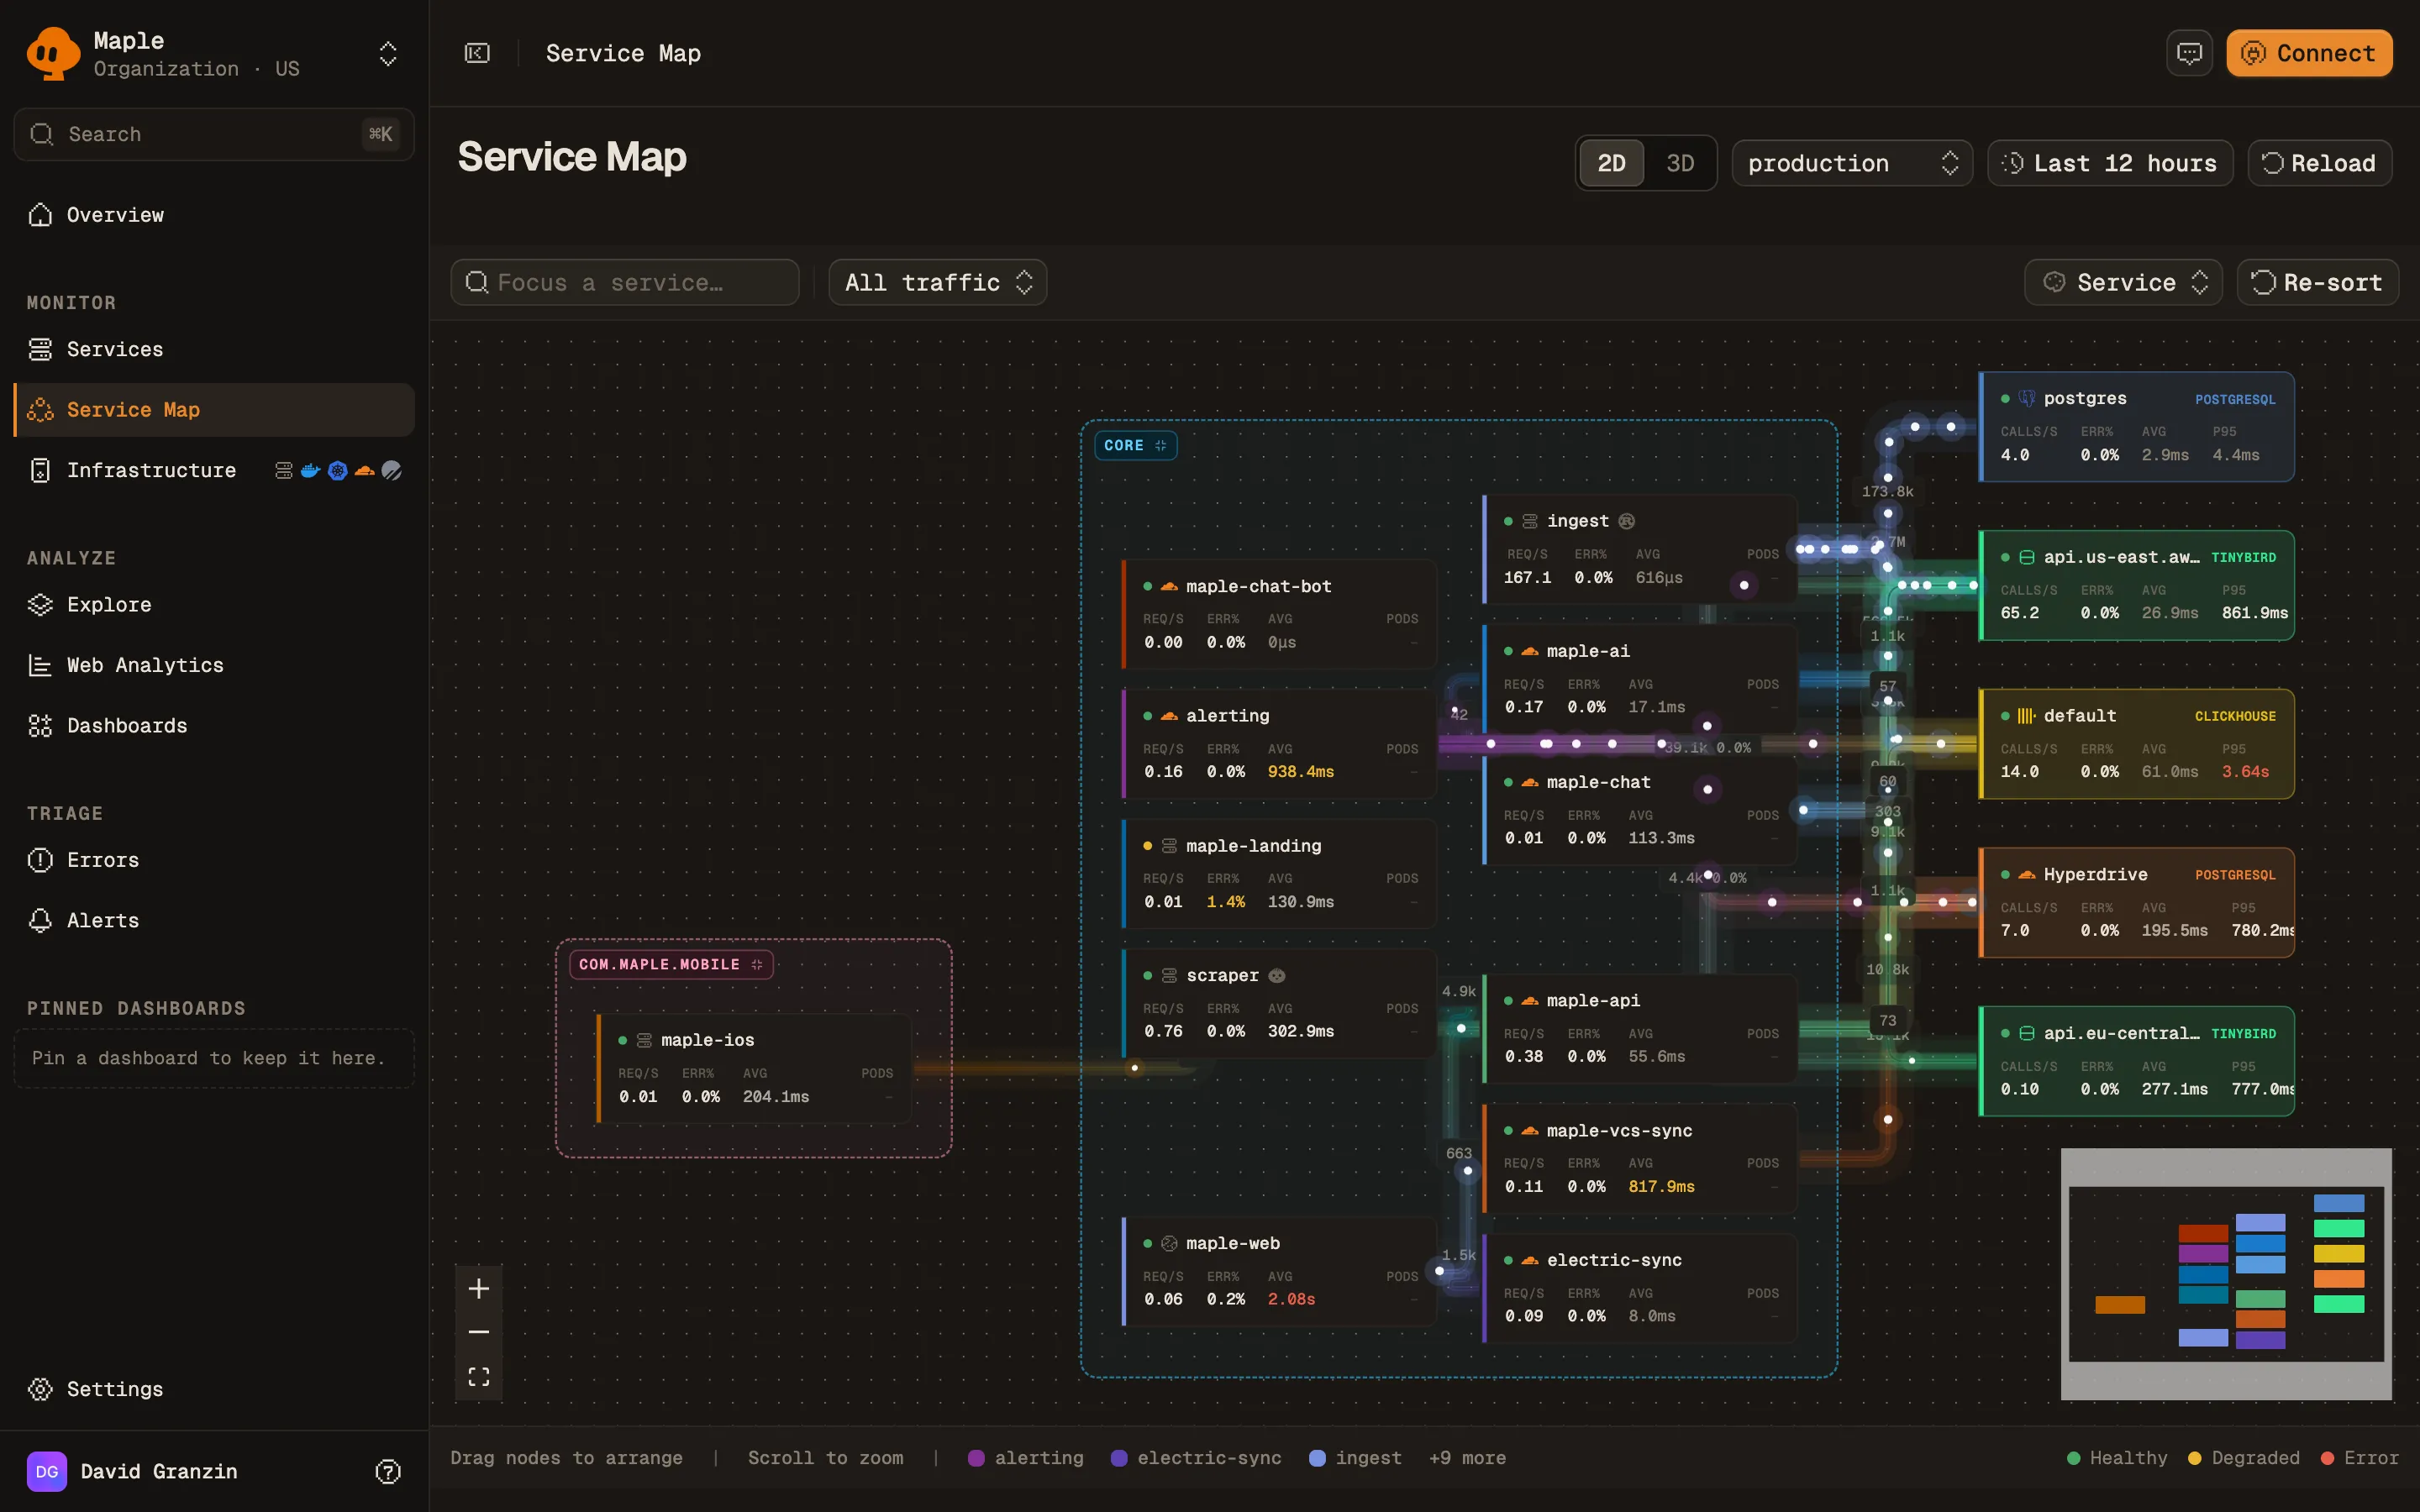
Node color follows error rate. The legend shows Healthy, Degraded (above 1%), and Error (above 5%).
Each edge shows its call count and, when above zero, its error percentage. Counts come from traced requests. When your SDK samples traces, counts are prefixed with ~ and the real rate may be higher. See Sampling and throughput.
The map shows at most 200 edges.
Controls
| Control | What it does |
|---|---|
| 2D / 3D | Switch between a flat layout (the default) and a 3D view. |
| Environment | Show one deployment.environment, or All Environments. Defaults to production when it exists. |
| Time range | Defaults to the last 12 hours. |
| Focus a service… | Center the map on one service and its neighbors. Pick 1 hop or 2 hops. Hide rest hides everything outside the focus instead of dimming it. Clear focus resets. |
| Traffic threshold | All traffic, or hide edges below 0.1%, 1%, or 5% of the busiest edge. A button shows how many services and edges are hidden. |
| Color nodes by | Service, Health, or Platform. |
| Re-sort | Discard manual positions and auto-arrange. |
| Zoom In, Zoom Out, Fit View | Canvas zoom. You can also scroll to zoom and drag nodes to arrange them. |
The focused service, hop count, and hide mode are kept in the URL, so you can share a focused view.
Node details
Click a node to open its side panel. Click the canvas to close it. Click a collapsed namespace to expand it.
A service panel has two tabs:
- Service: Throughput, Error Rate, Avg Latency, and P95 Latency, plus Dependencies and Called By lists. View service opens the service page.
- Infrastructure: the Kubernetes workloads running the service. See Kubernetes to set it up.
A database panel shows Queries, Throughput, Error Rate, P50 Latency, P95 Latency, and Avg Latency.
Query the map from an assistant
The MCP server tool service_map returns the edges with call counts, error rates, and latency, filtered by service and environment.
Troubleshooting
- “No service map yet”. Maple has not seen a cross-service call or a database call. Instrument at least two services that call each other, or a service with database instrumentation. If your services are active, widen the time range.
- Two services are not connected. The callee is not instrumented, or the caller drops the
traceparentheader (common across proxies, queues, and custom HTTP clients). Open a trace for the call and check that the callee’sServerspan has the client span as its parent. - Every database collapses into one node. Set
db.namespaceon database spans, or at leastserver.address. - The same database appears twice. Services spell
db.system.namedifferently (for examplepostgresqlandPostgreSQL). Use the OpenTelemetry well-known values. - The Infrastructure tab says “No Kubernetes workloads found”. The service’s spans lack Kubernetes workload attributes. See Kubernetes.
Next steps
- OpenTelemetry conventions: attributes that shape the map.
- Services: per-service metrics and all outbound dependencies.
- Traces: inspect the calls behind an edge.