A service map that builds itself

Maple builds the map from your traces. There is nothing to configure, and a new service appears the first time something calls it.

The surface

Every service, one table

Latency, error rate and throughput per service. Sort by p99 to find the one that needs attention.
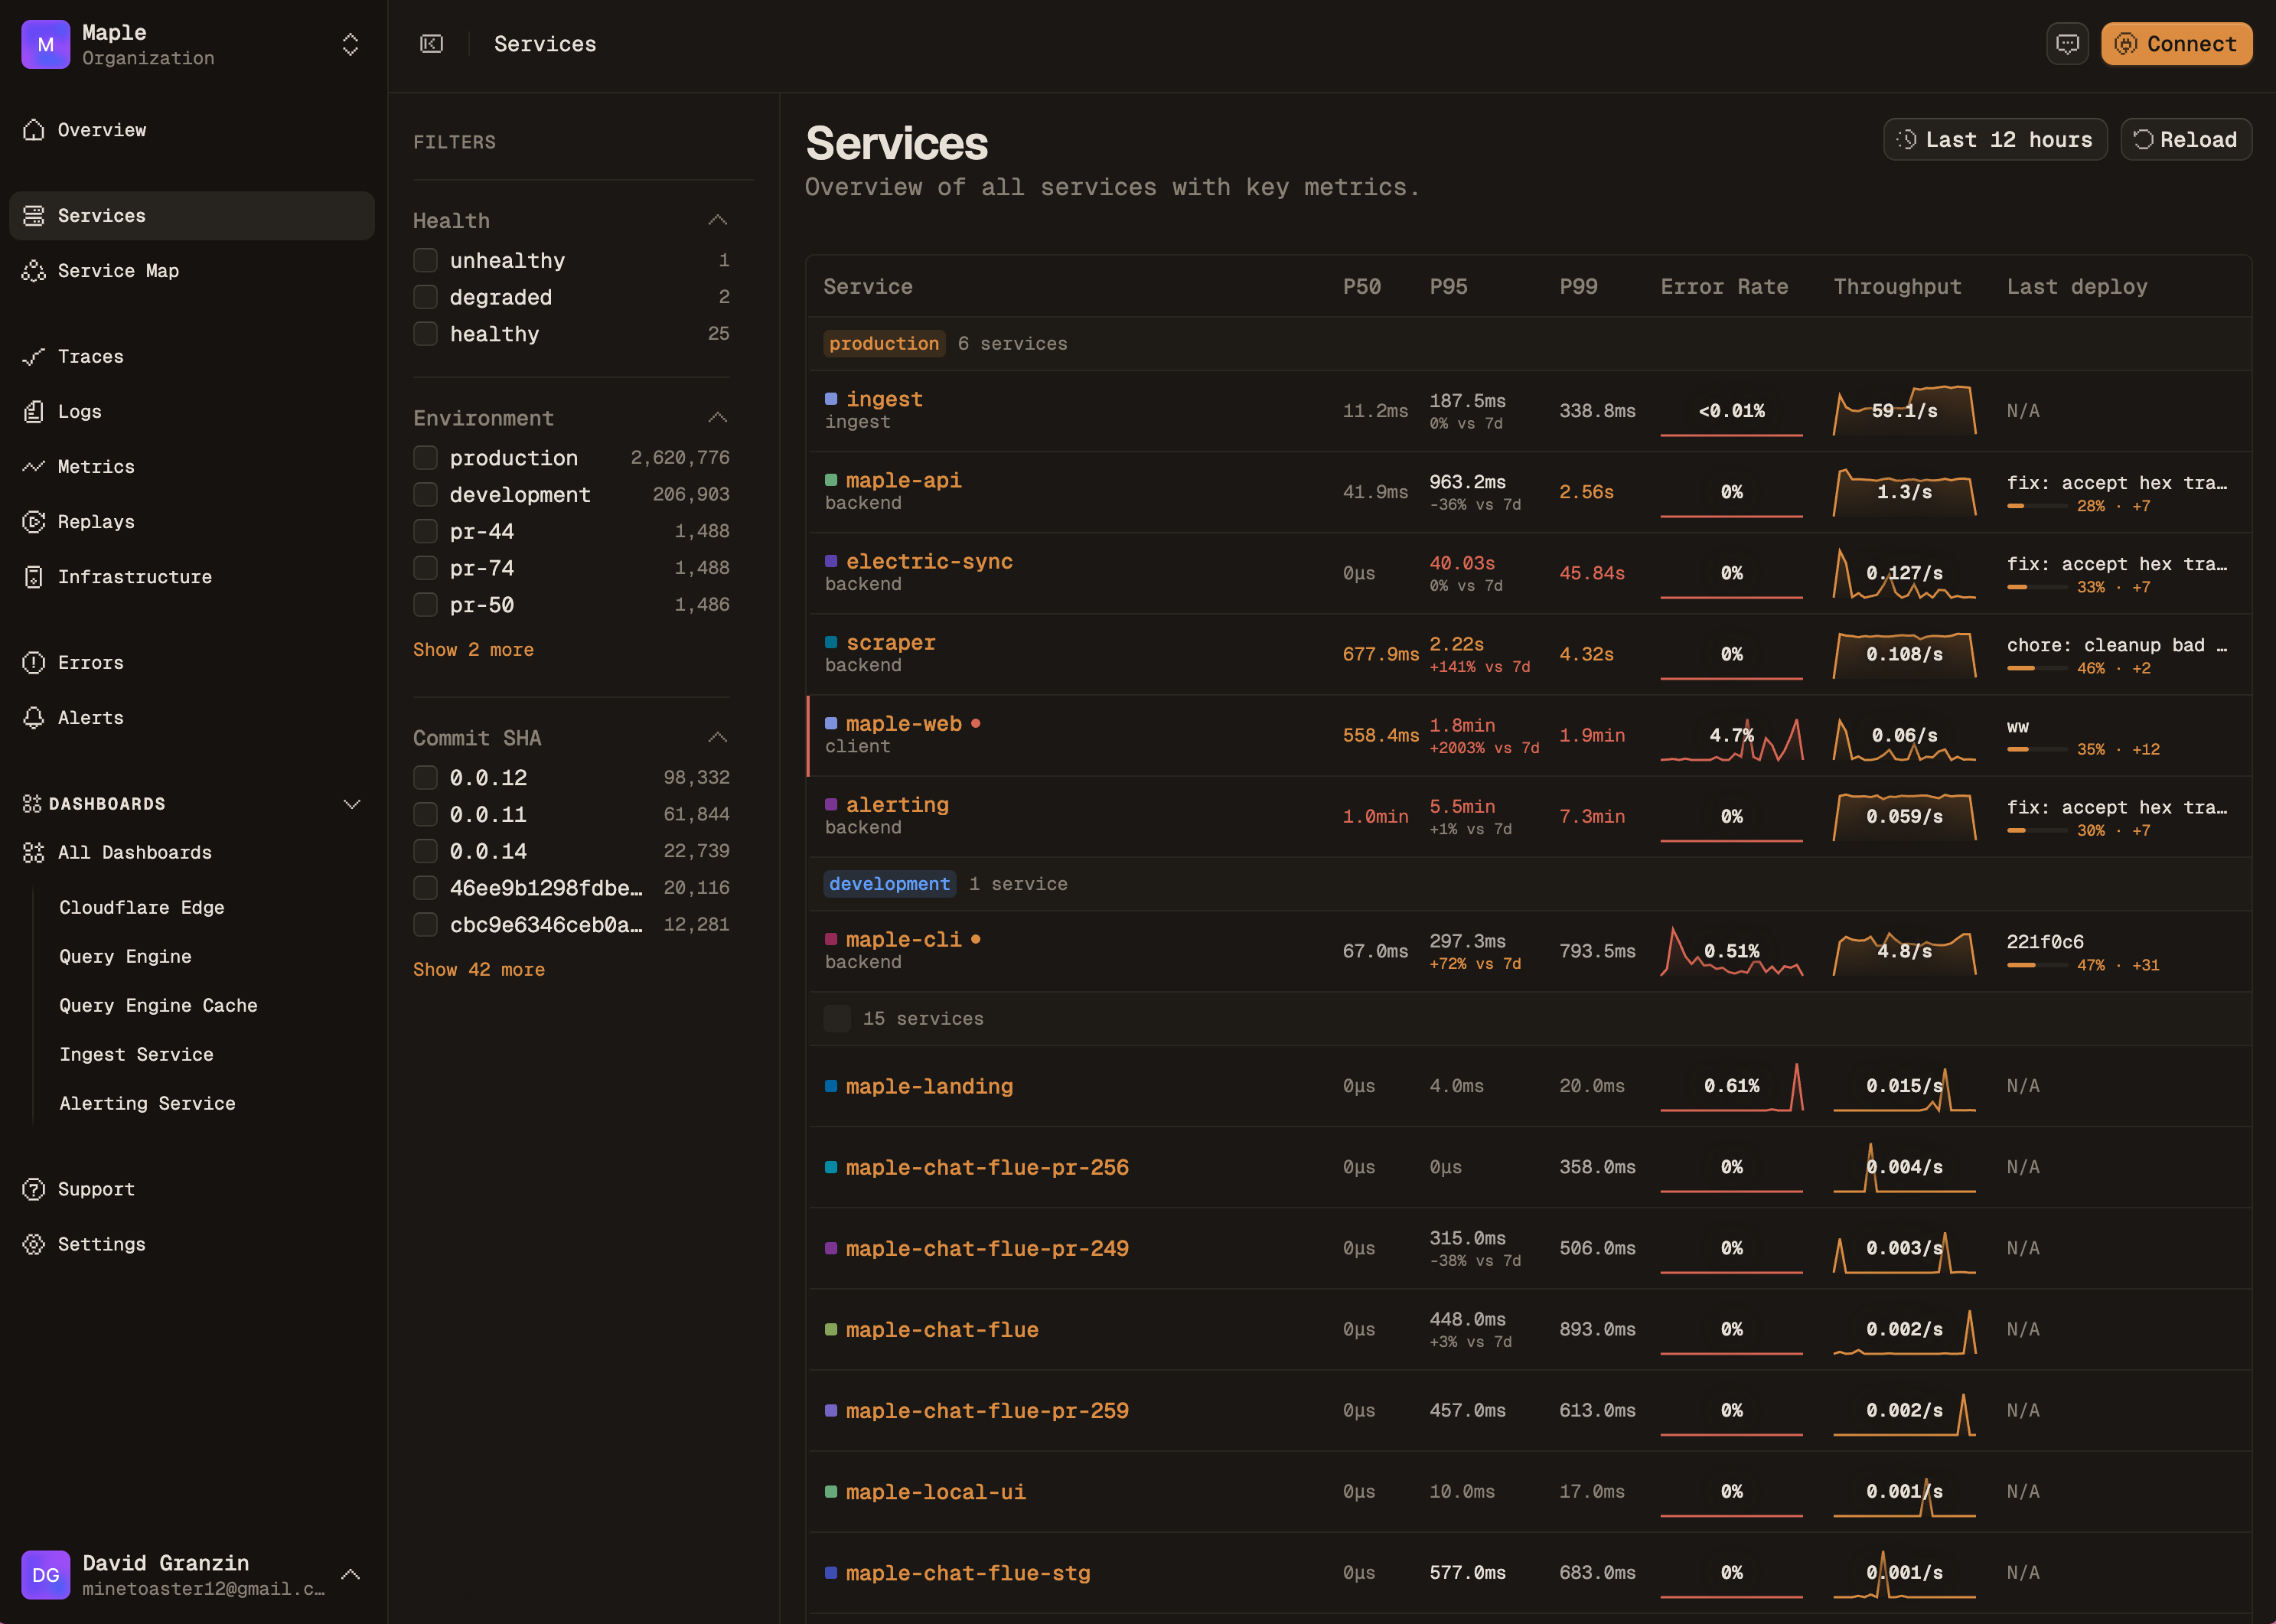
The service catalog listing latency percentiles, error-rate trends and throughput per service
/services 12 services · env production
topology
derived from spans
nodes
service · db · cache · external
edges
parent → child
per.service
p50 · p95 · p99 · error% · req/s
color
16 hues · service identity

In motion

Live traffic

Each service shows its request rate, error rate and latency. Lines show traffic between them.

service map · last 60s LIVE
2.8k req/s edge req/s 12.4k err% 0.1% avg 8ms checkout-api req/s 4.2k err% 0.3% avg 24ms cart-svc req/s 8.1k err% 0.1% avg 18ms auth-svc req/s 4.2k err% 0.0% avg 6ms pricing req/s 2.8k err% 2.4% avg 142ms payments req/s 1.1k err% 0.5% avg 38ms redis DB calls/s 18.2k avg 2ms postgres DB calls/s 6.4k avg 14ms
8 services · 8 edges · 60s window pricing-svc · p99 +18% vs 1h ago

More screens

Service Catalog & Map, screen by screen

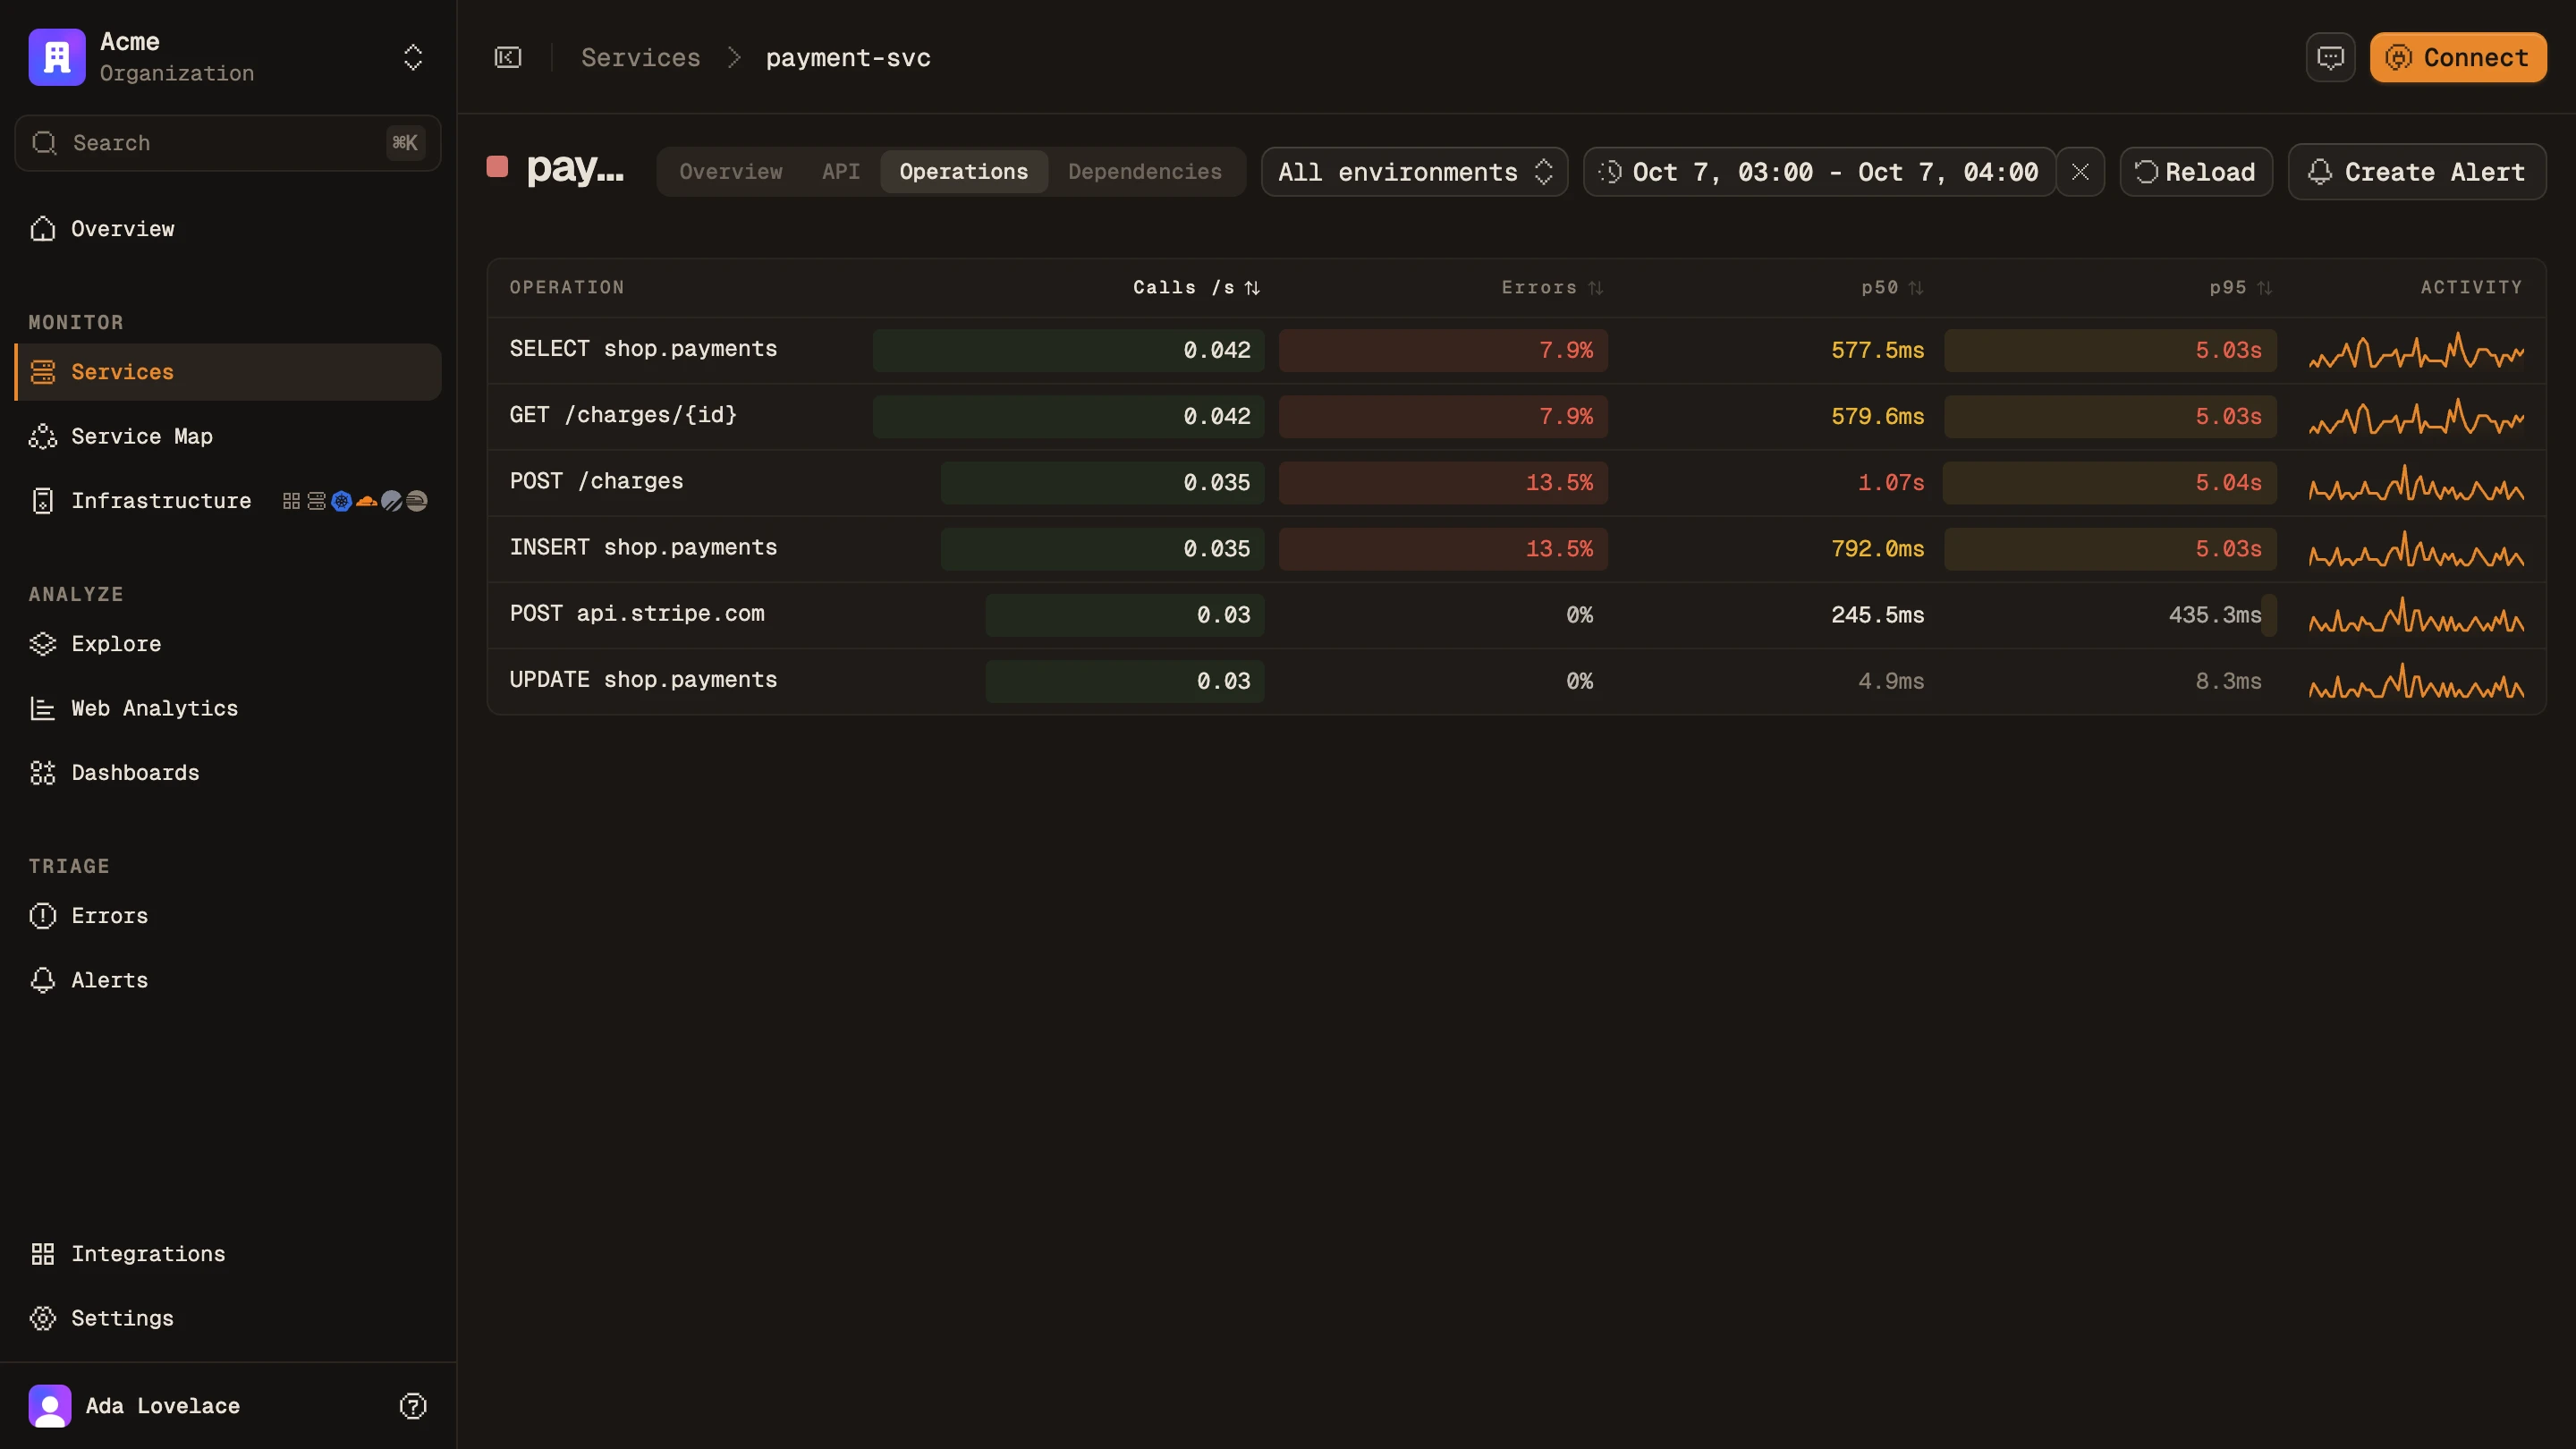
/services/:name Operations, slowest first
payment-svc operations: the payments queries and POST /charges at 10 to 12% errors and a 5 second p95
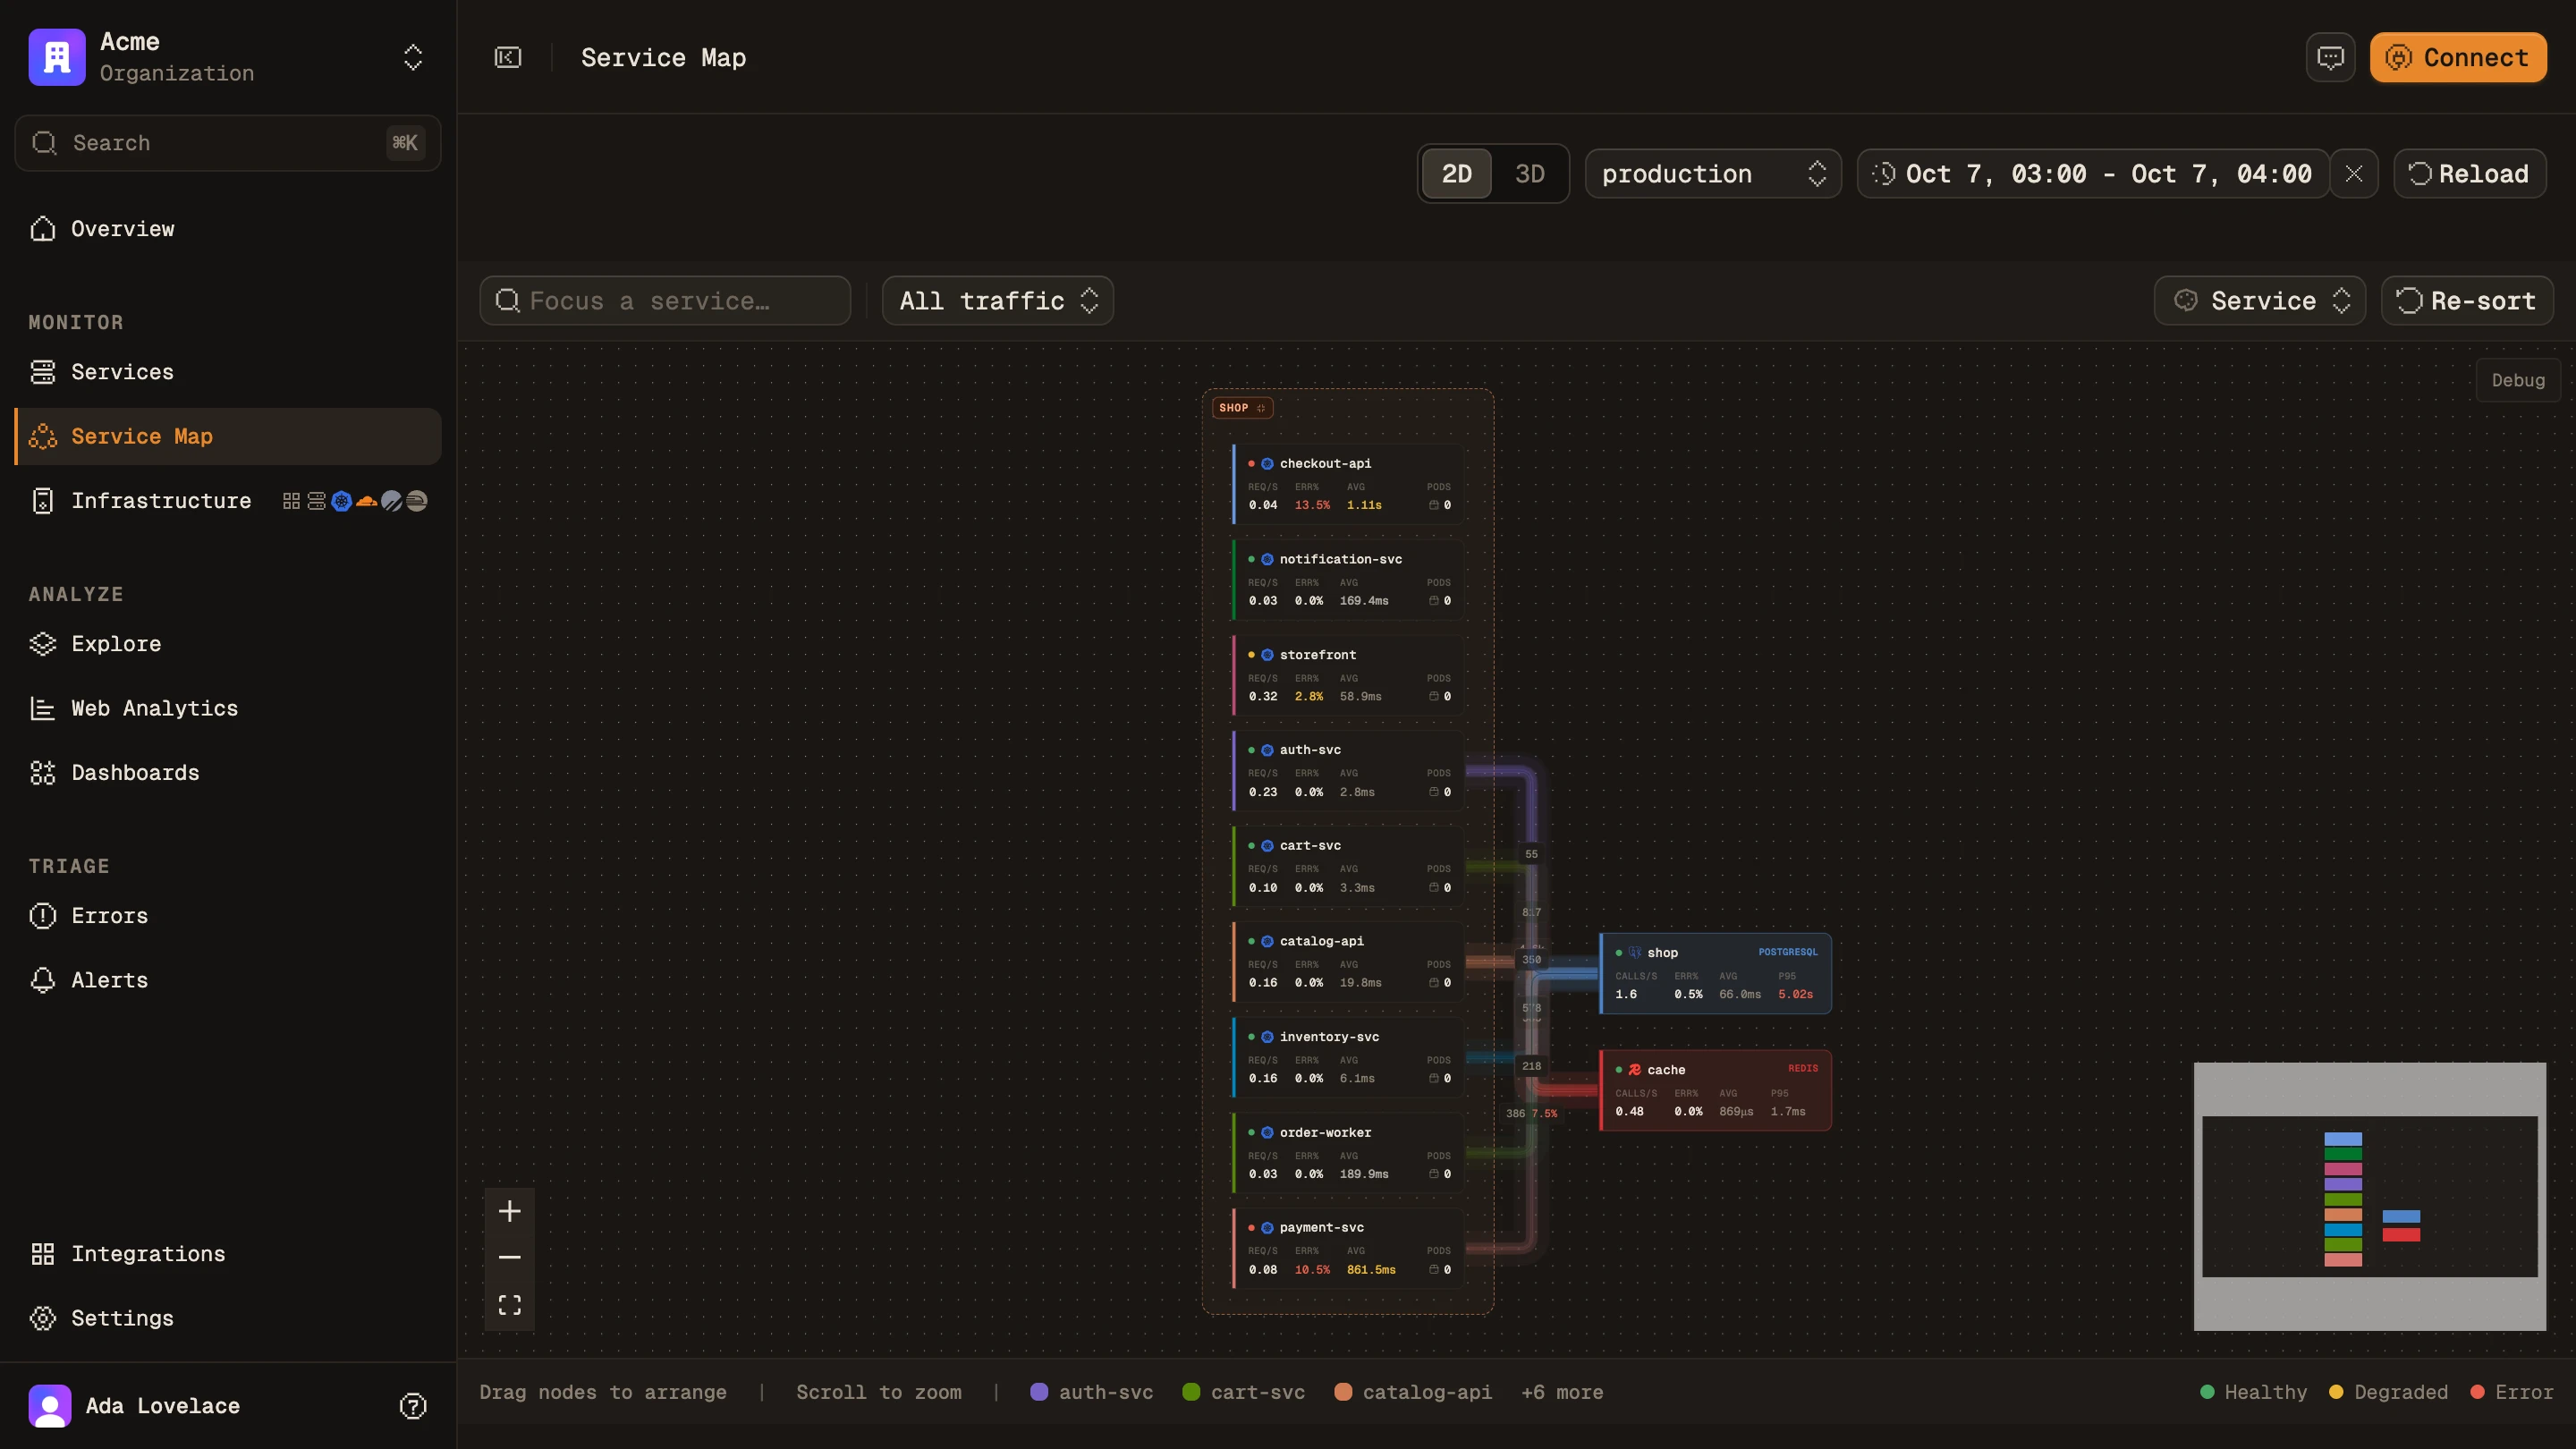
/service-map Built from real calls
The service map grouped by namespace, with databases, caches and the failing edge in red
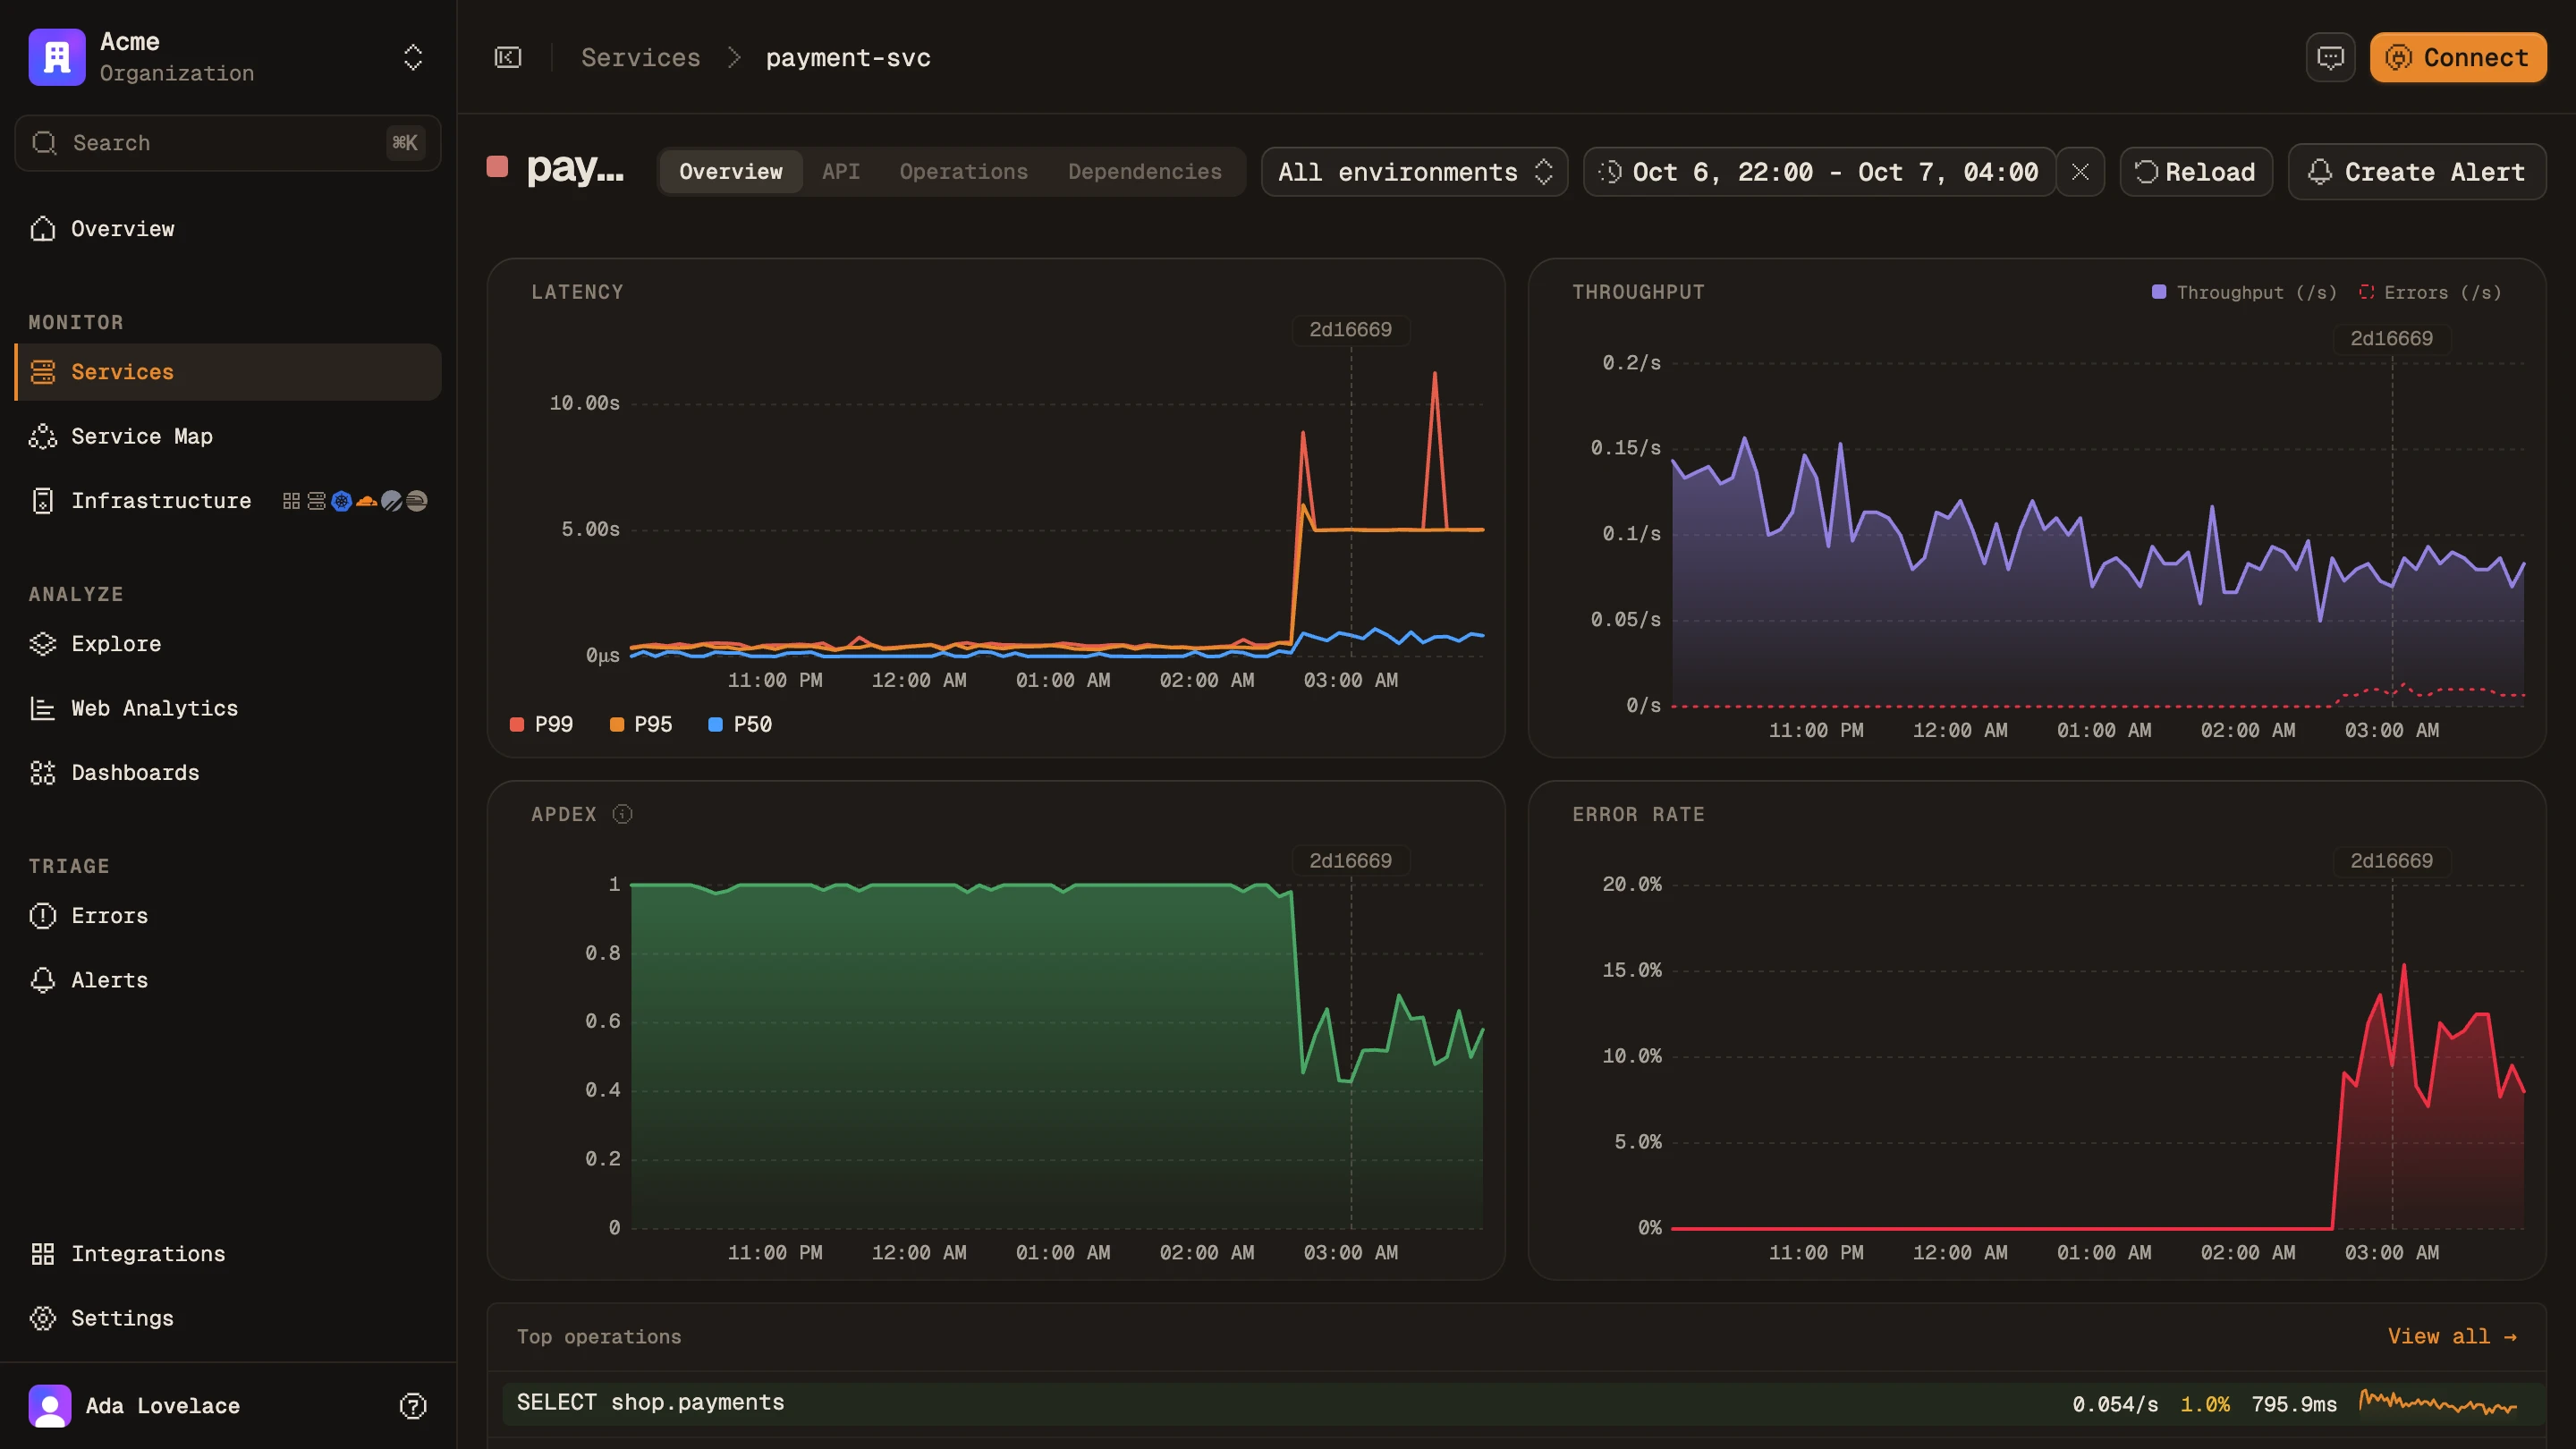
/services/:name Deploy on the chart
payment-svc latency, Apdex and error rate with the 3.5.0 deploy marked
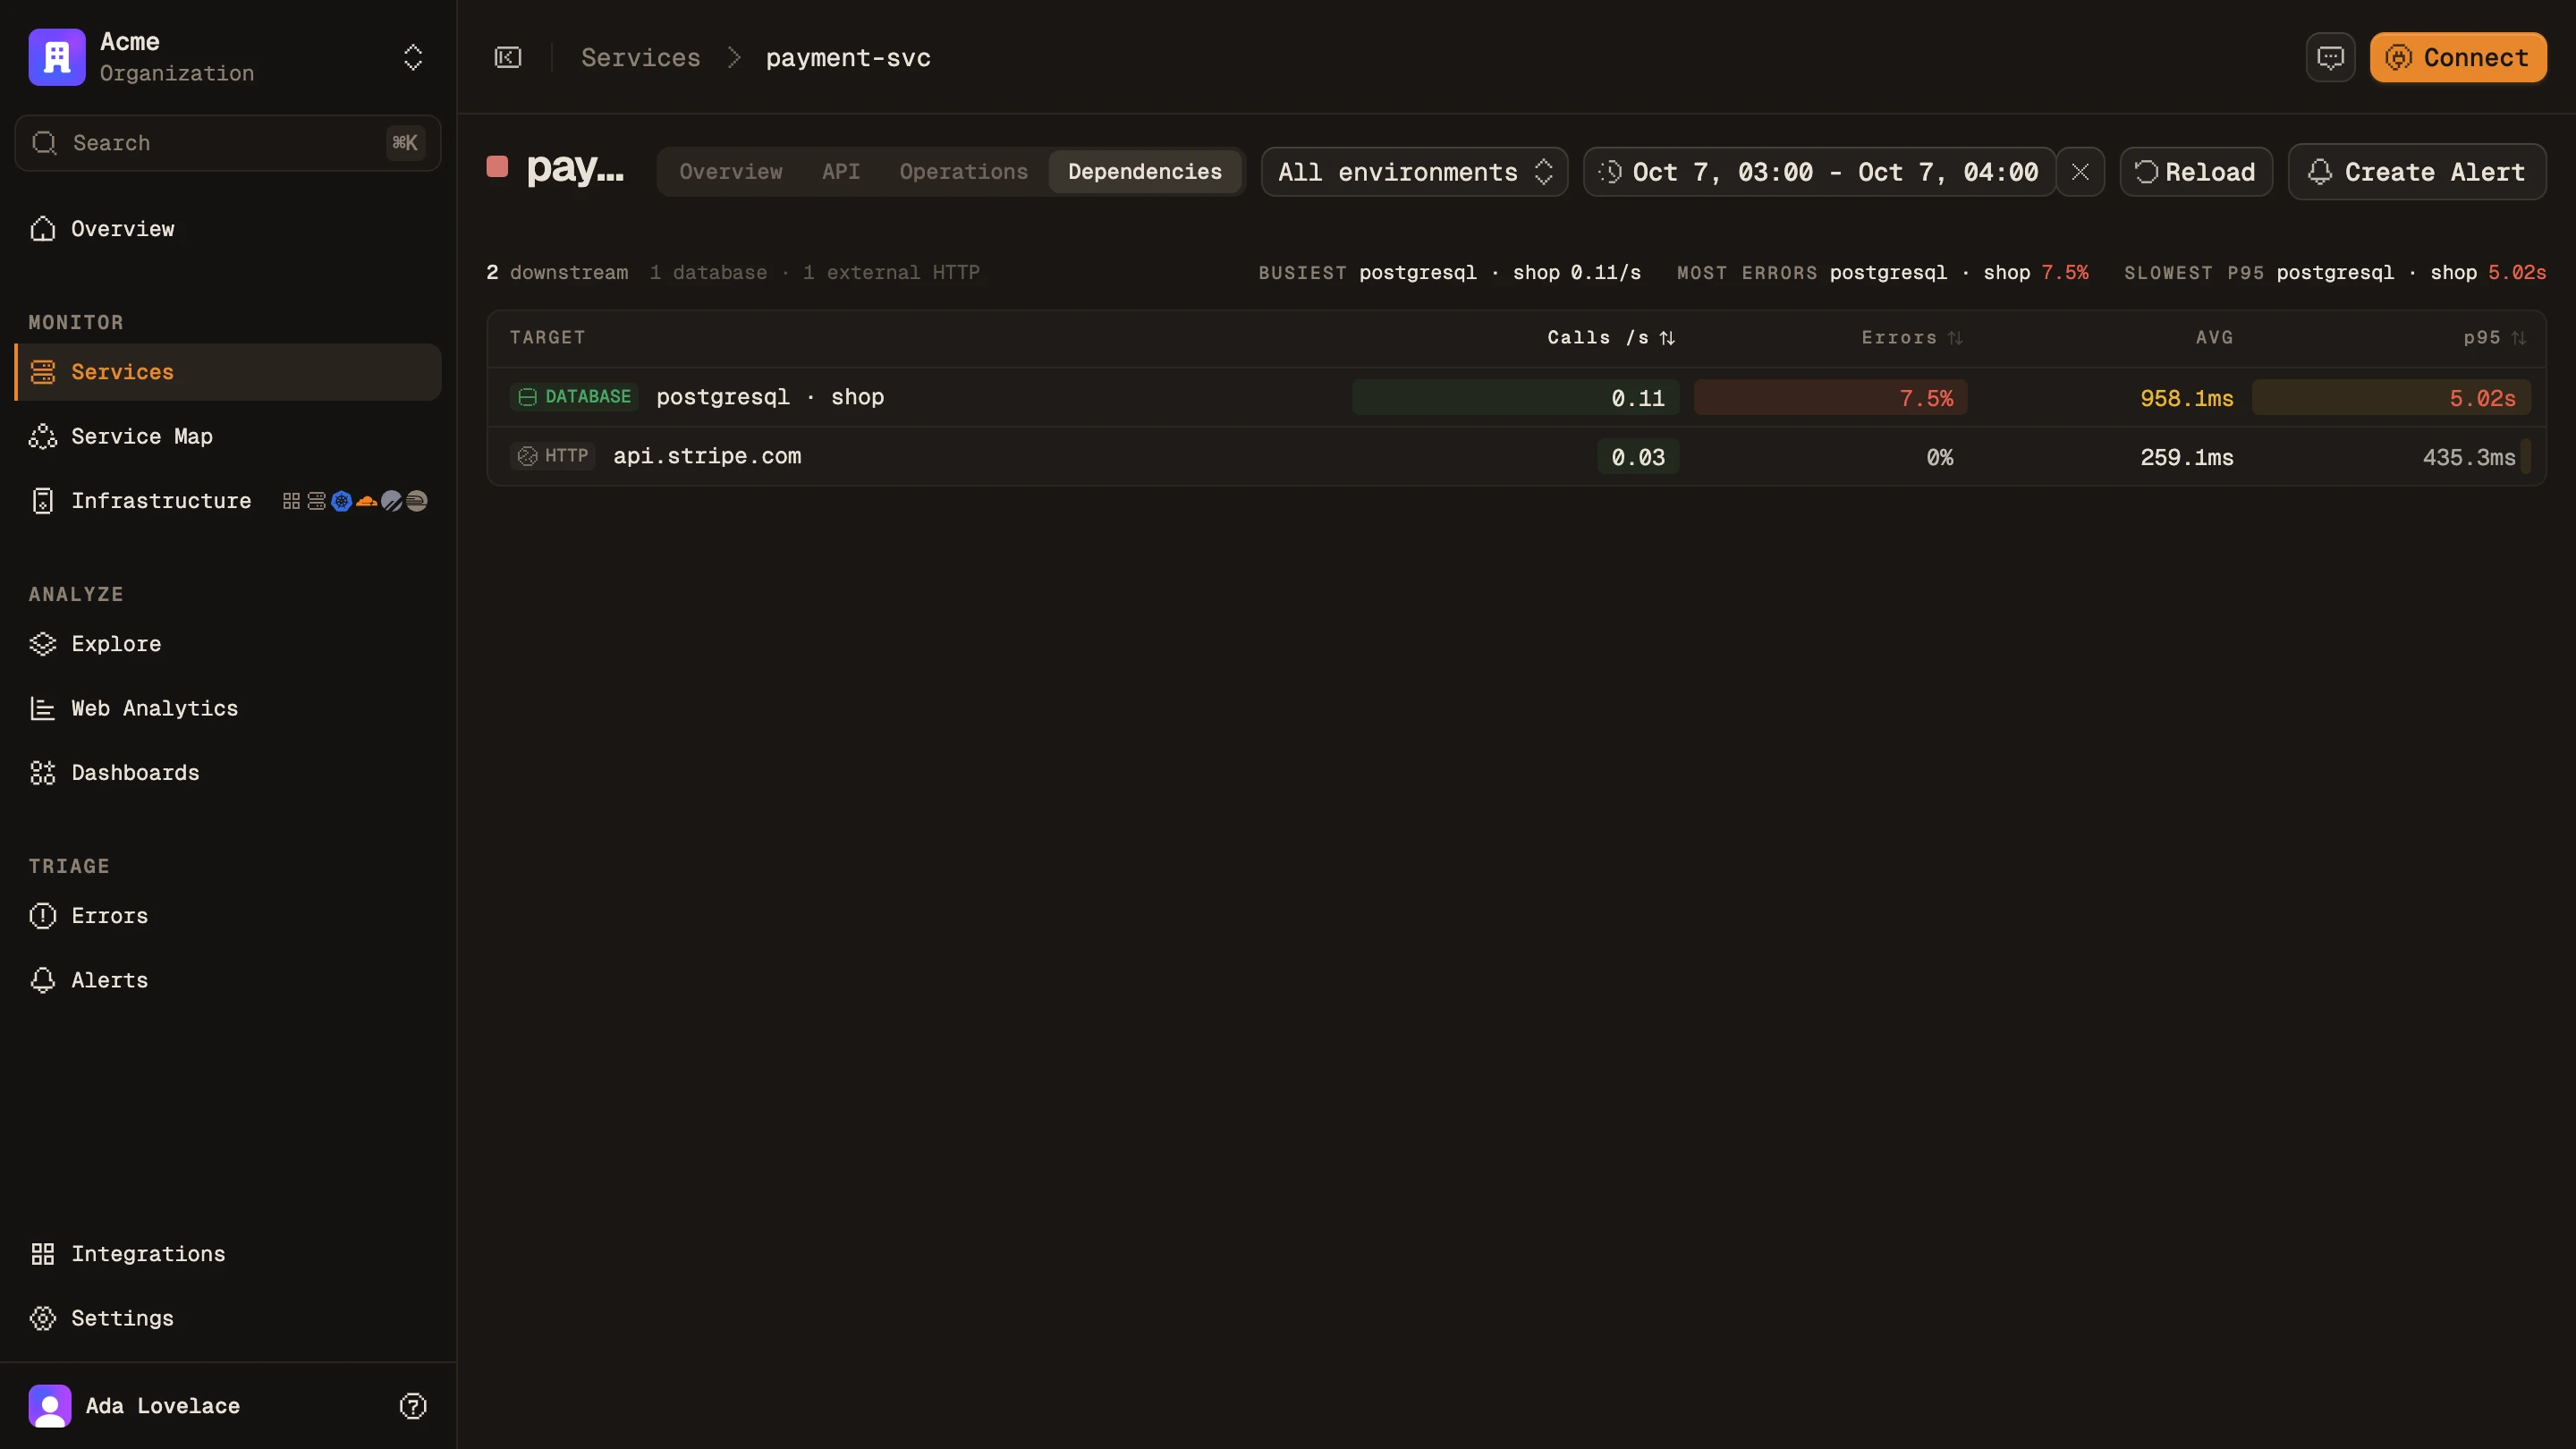
/services/:name What it calls
payment-svc dependencies: Postgres at 7.8% errors and a 5 second p95, and api.stripe.com

What it does

Reading the map

edges
Built from real calls
Every line is traffic that actually happened, with its own request and error rate.
db.system
Databases and caches too
Postgres, Redis and third-party APIs appear on the map next to your services.
1-hop / 2-hop
Focus on one service
Pick a service to see only what it talks to. On a map of forty services, that is usually a handful.
service.name
One color per service
Each service keeps its color on the map, in traces and in charts.
service.version
Deploys on the chart
Releases are marked on each service's latency chart, so you can see which version caused a change.

Keep going

Related features

Point OTLP at Maple.

One endpoint, one key. Traces, logs, metrics and sessions, linked from the first request.