Charts and traces that always agree

Dashboards read the same data as your traces. If a chart shows p99 at 380 ms, the traces behind it are one click away.

The surface

Every metric your services send

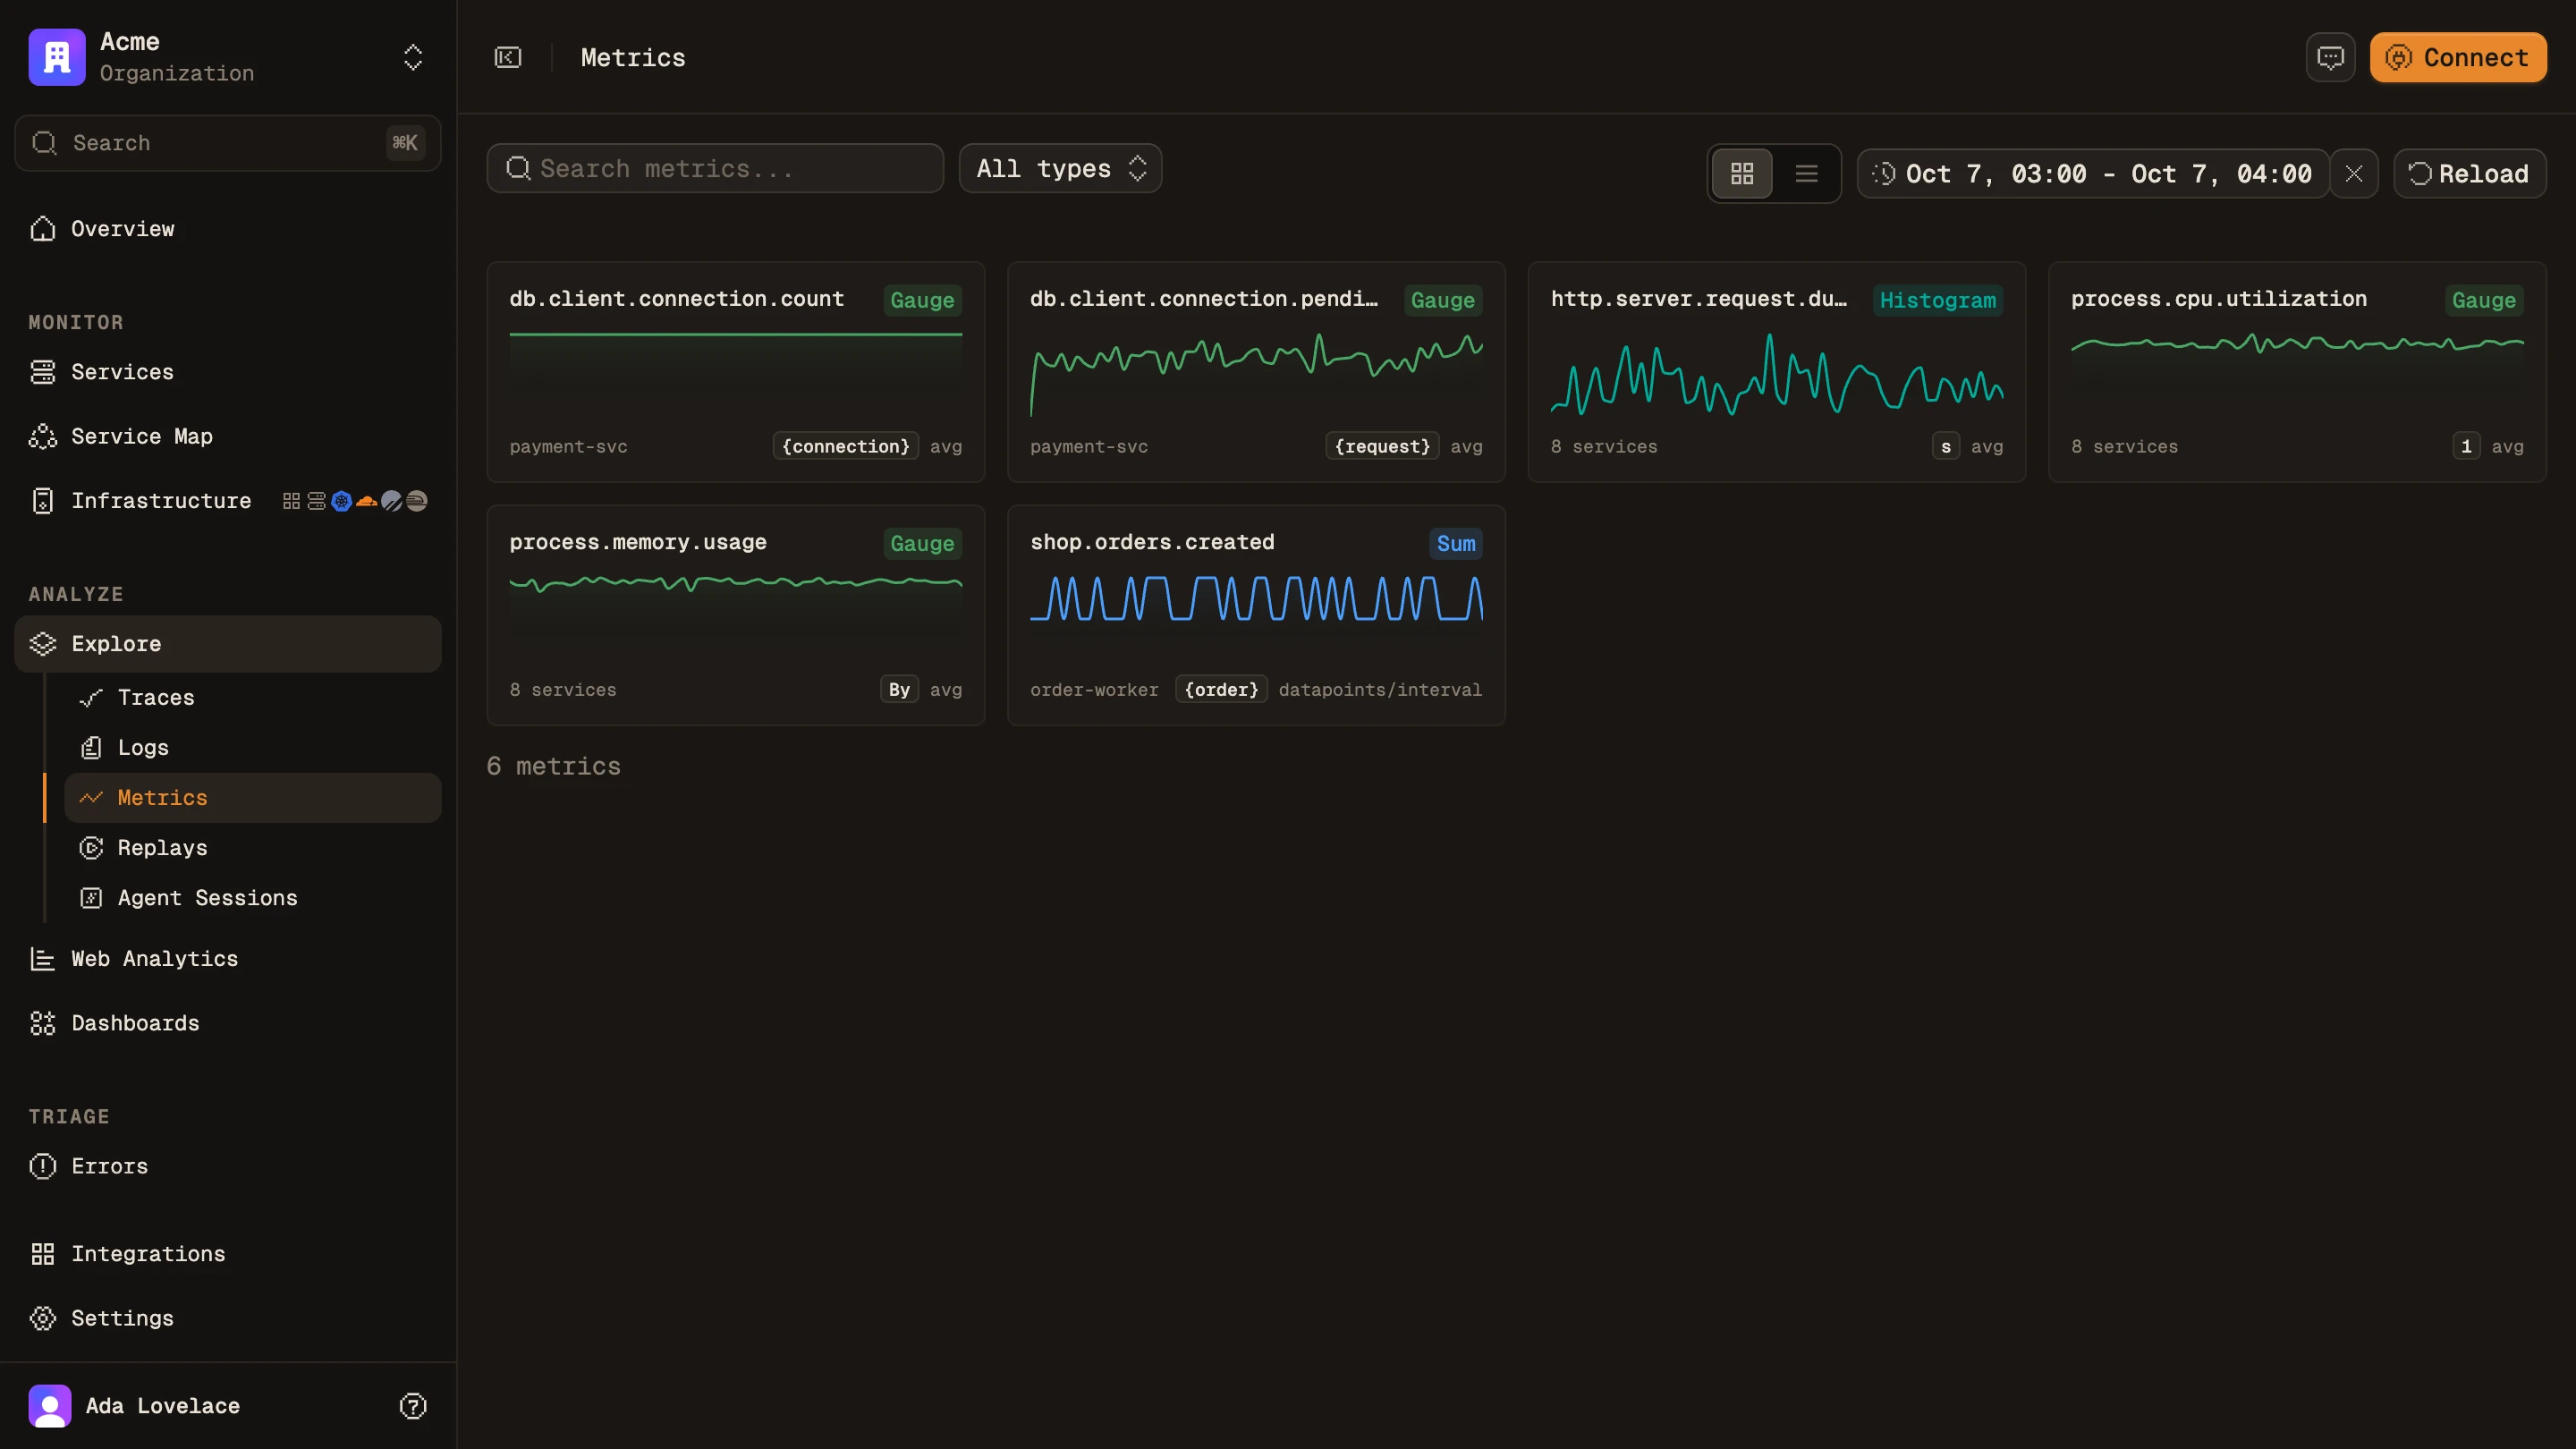
See each metric's type, the service that sends it, and when it was last seen.
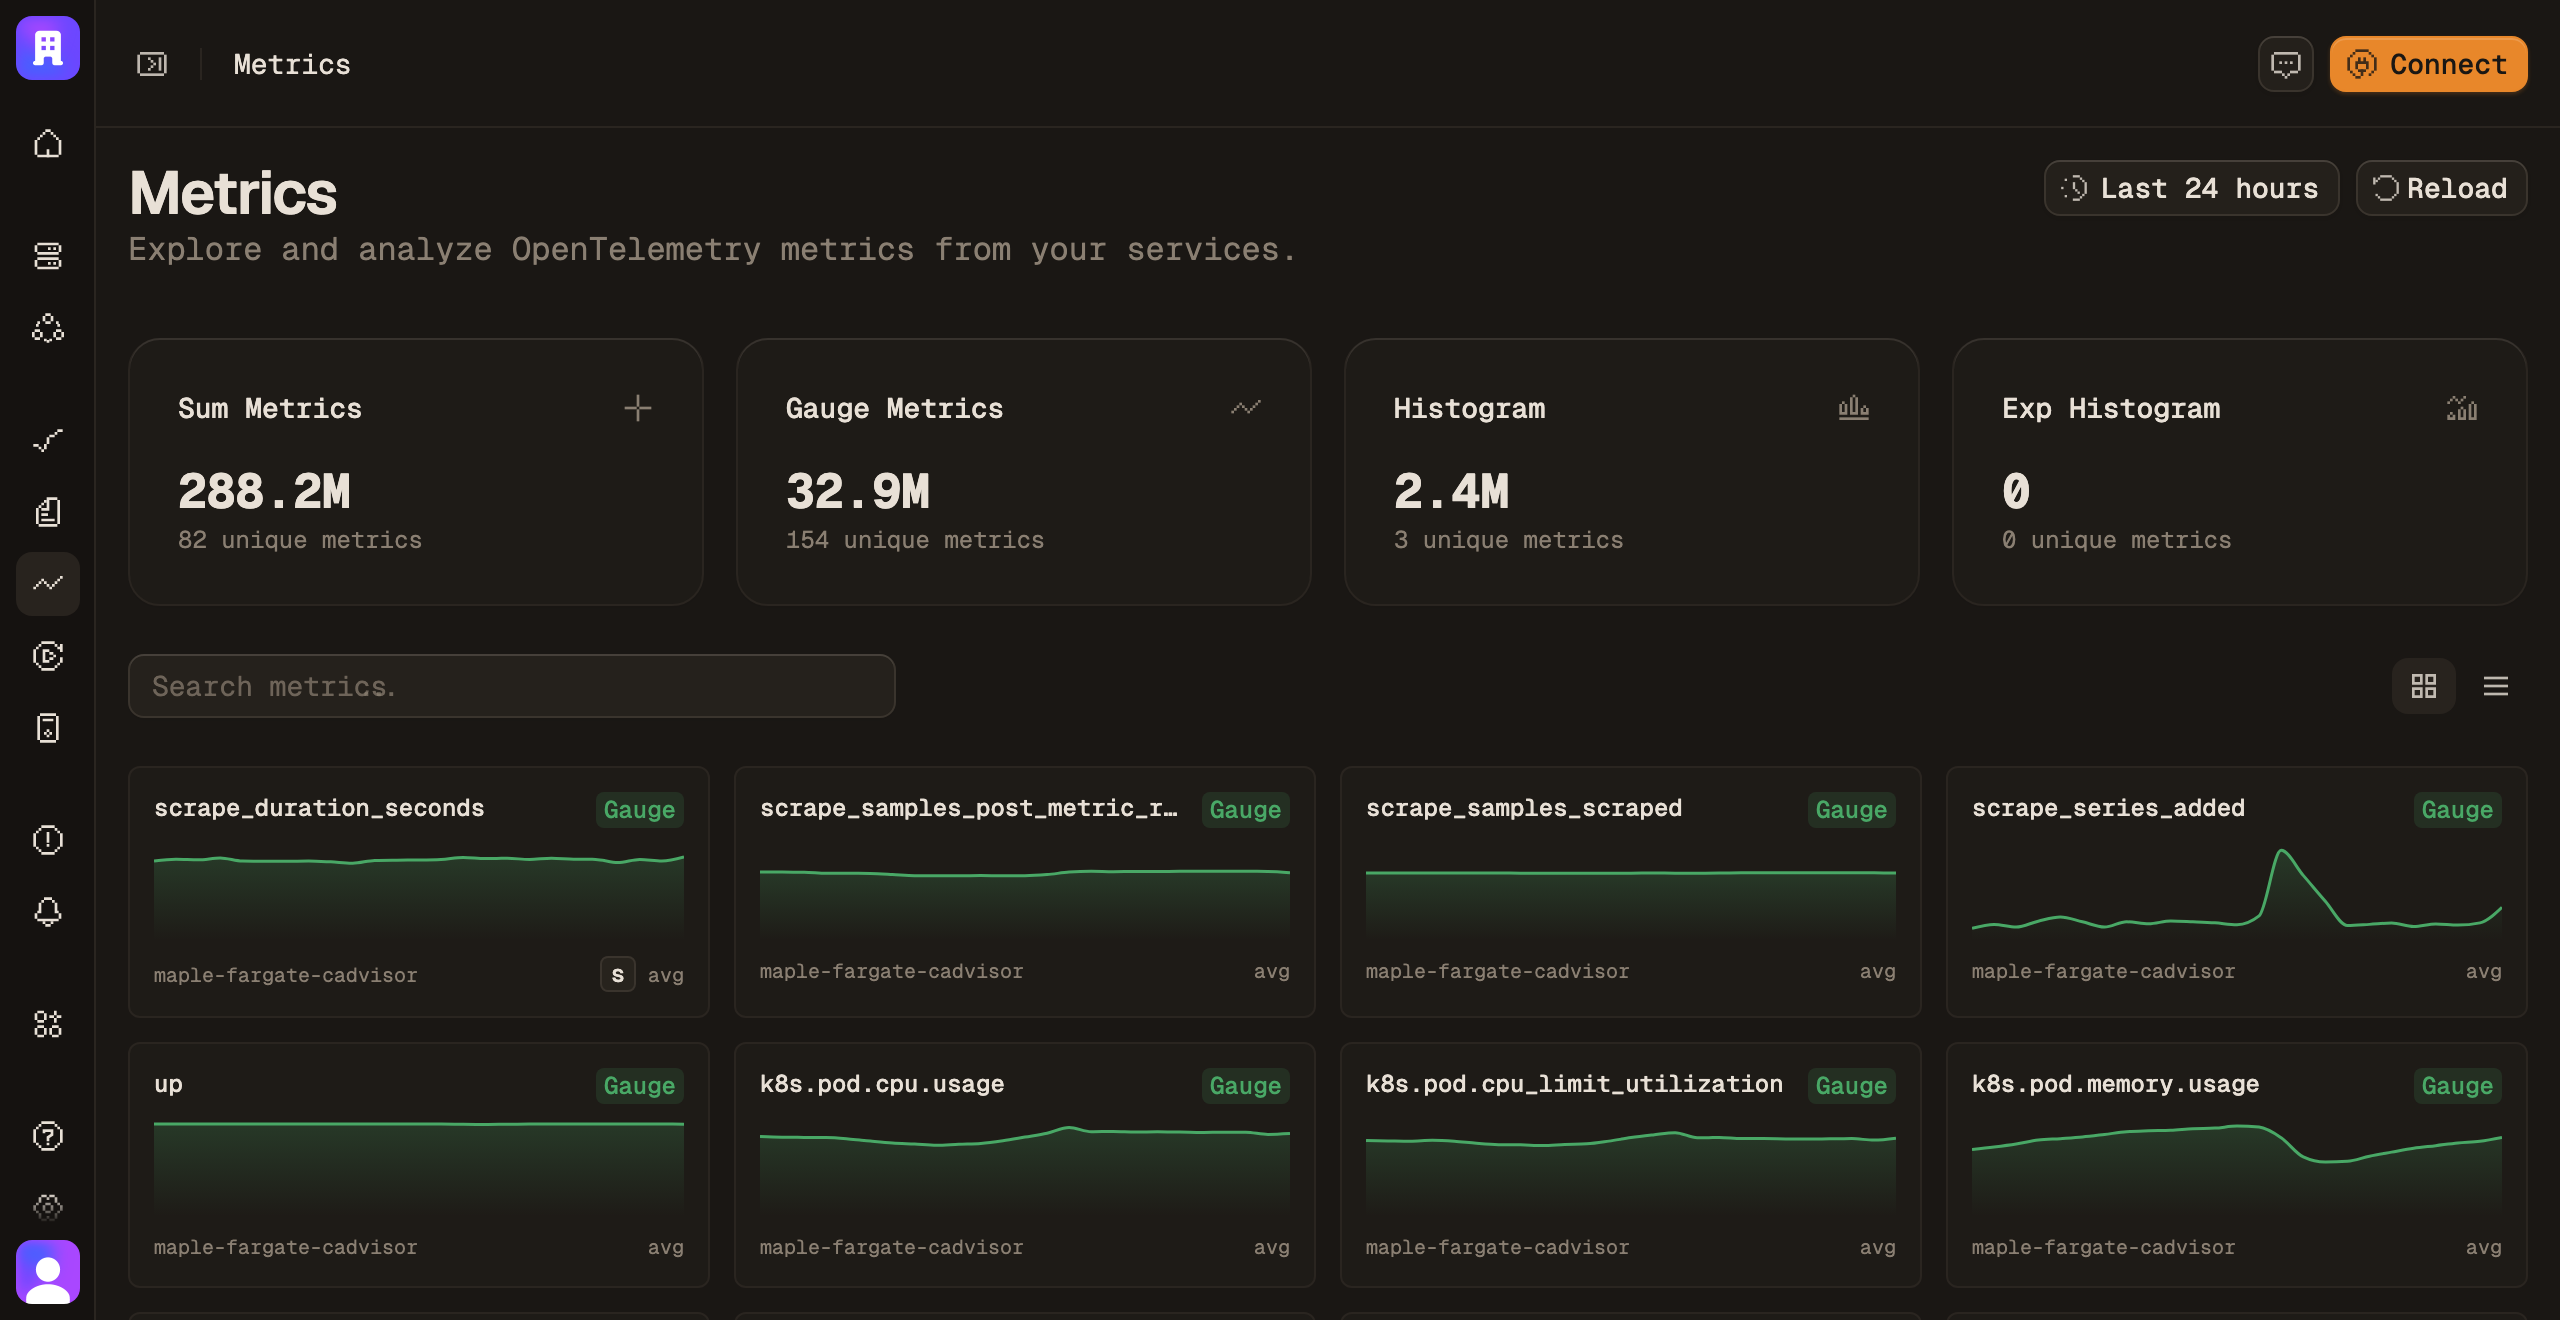
The metric explorer listing every metric with its type, service and data point count
/metrics http.server.request.duration
signal
metrics
temporality
delta · cumulative
widgets
series · stat · table · histogram
percentiles
p50 · p95 · p99
variables
$service · $env

In motion

Log volume by severity

Five hours in five-minute buckets. A single number would hide the warning spike and the errors after it.

/logs live
logs · volume · last 5hLIVE
14.0K logsin selected range
4 severities · 60 buckets · 5m eachwarn cluster 11:10–11:40 · error blip 11:50

More screens

Metrics & Dashboards, screen by screen

/metrics Every metric, typed
The metric explorer listing each metric with its type, service and last seen time
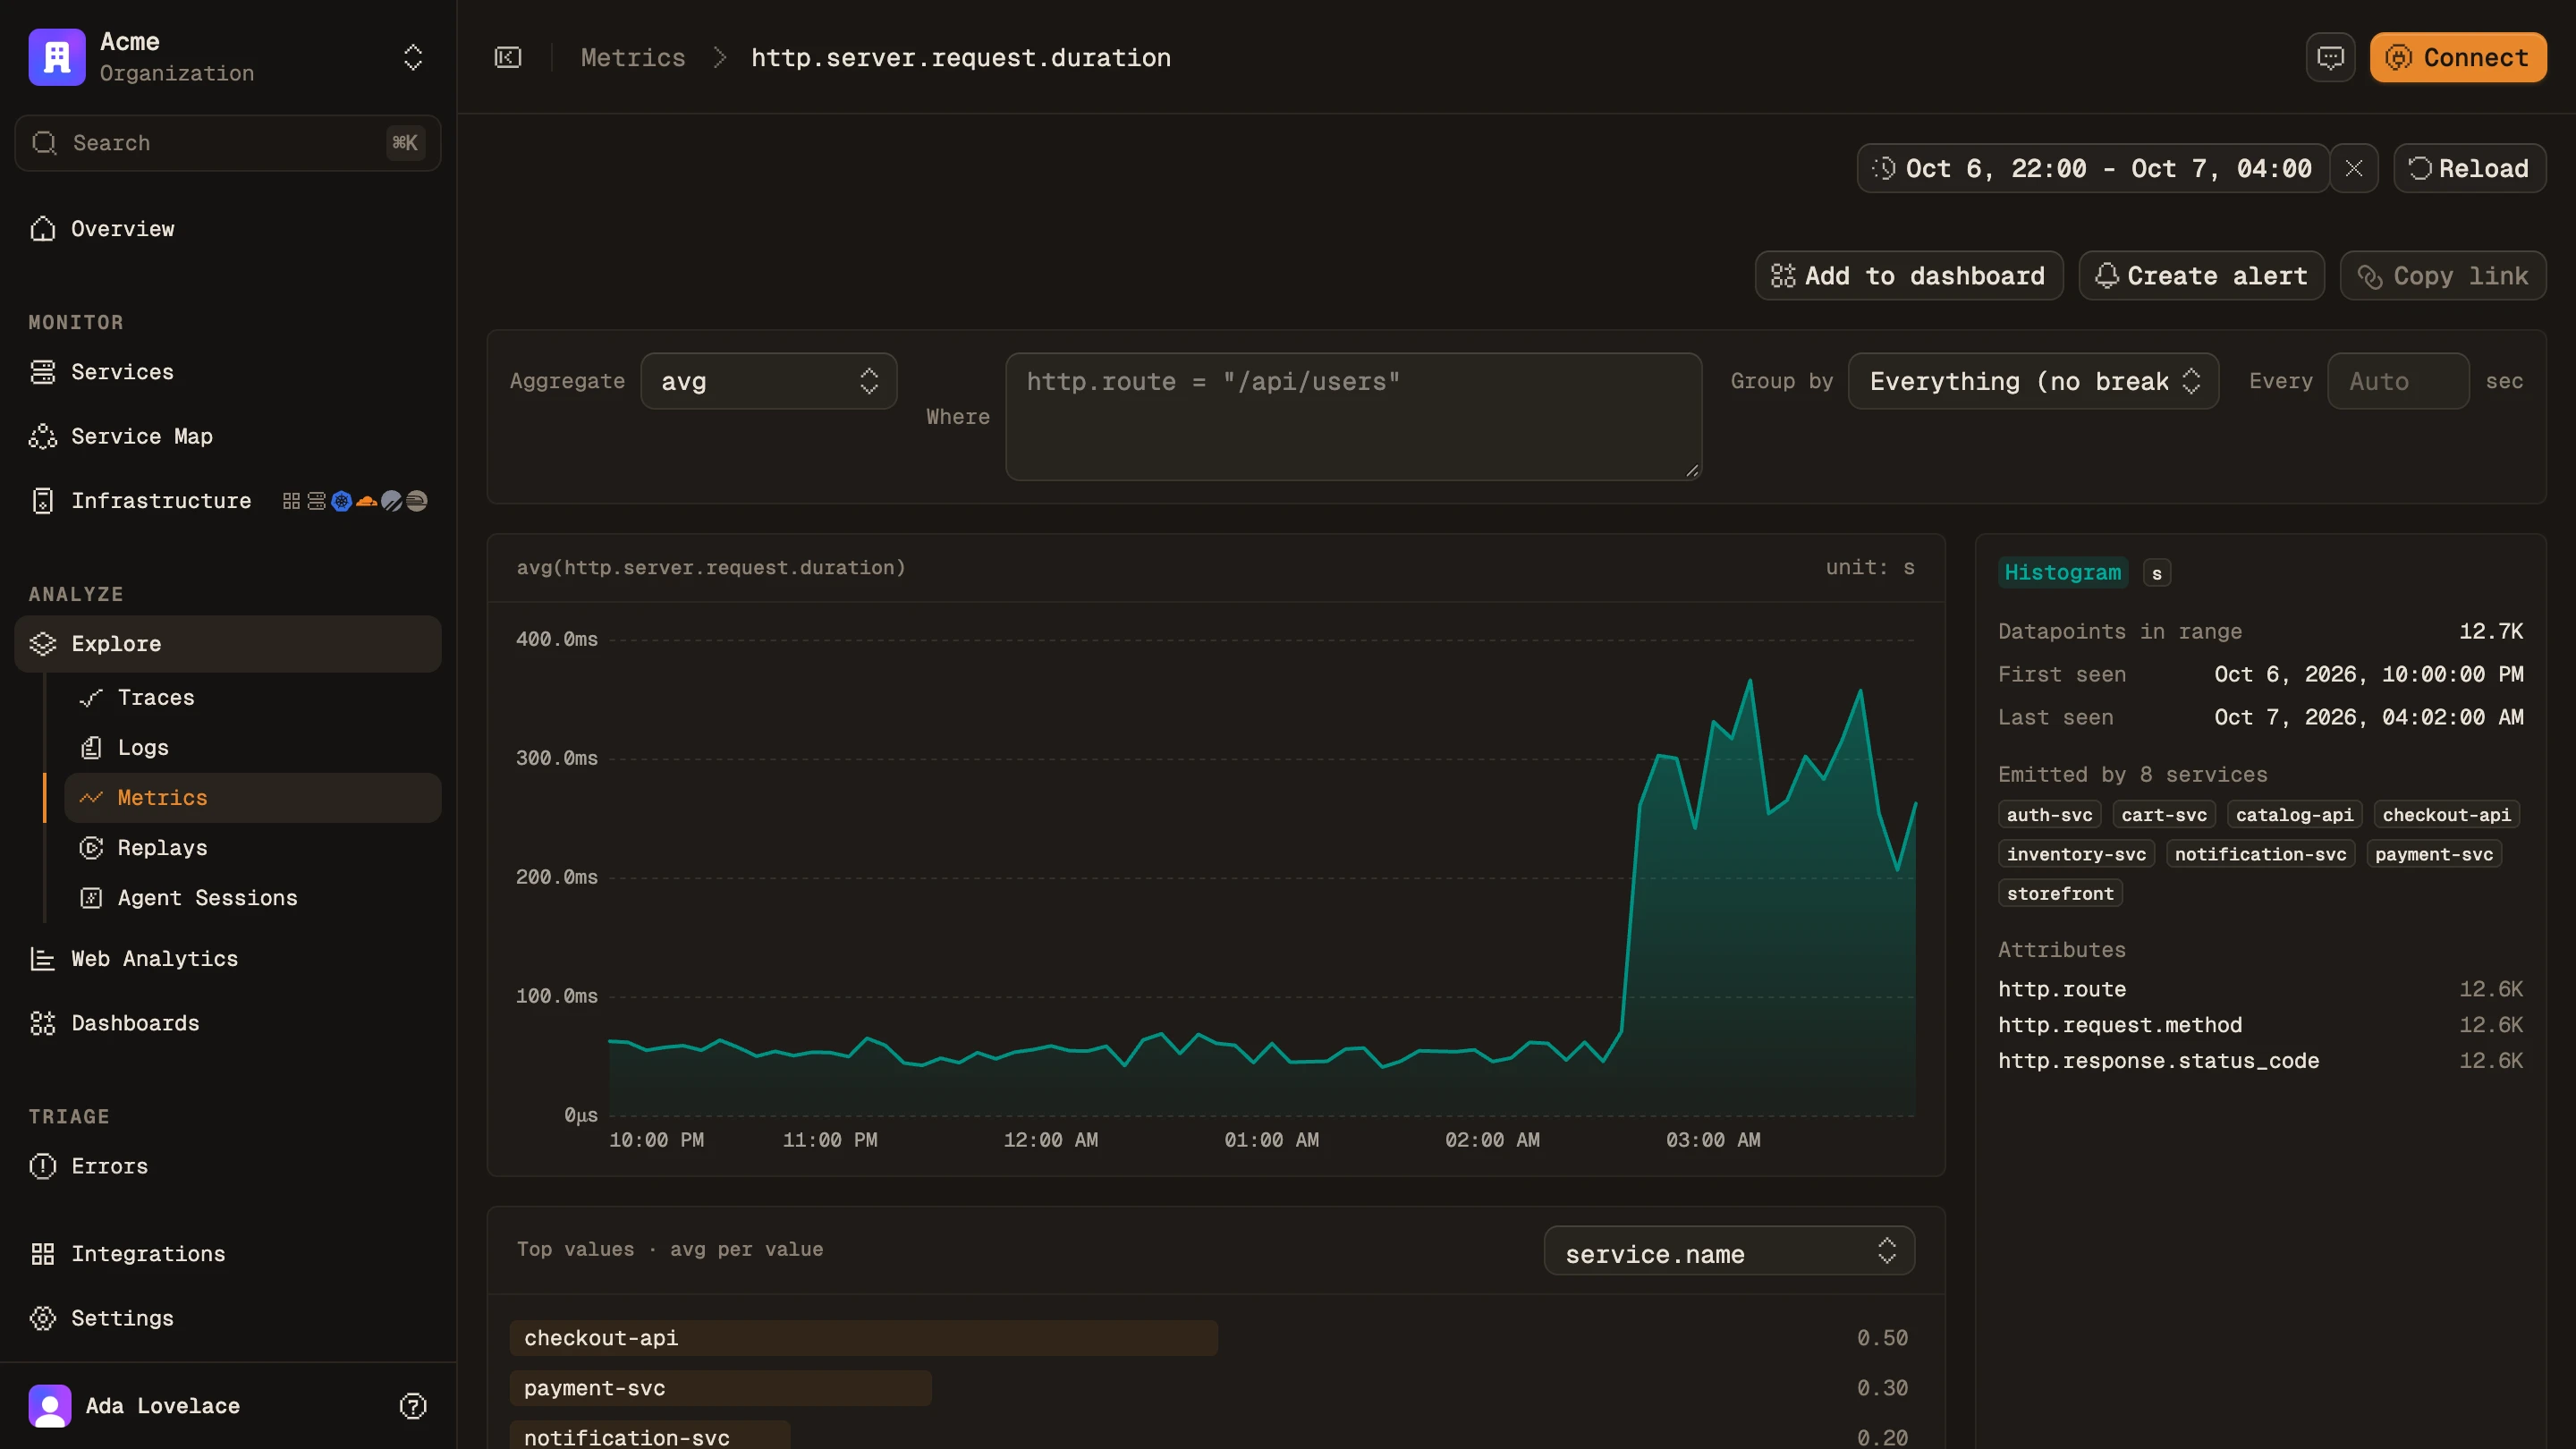
/metrics/:name Request duration
http.server.request.duration charted over six hours, with the jump after the bad deploy
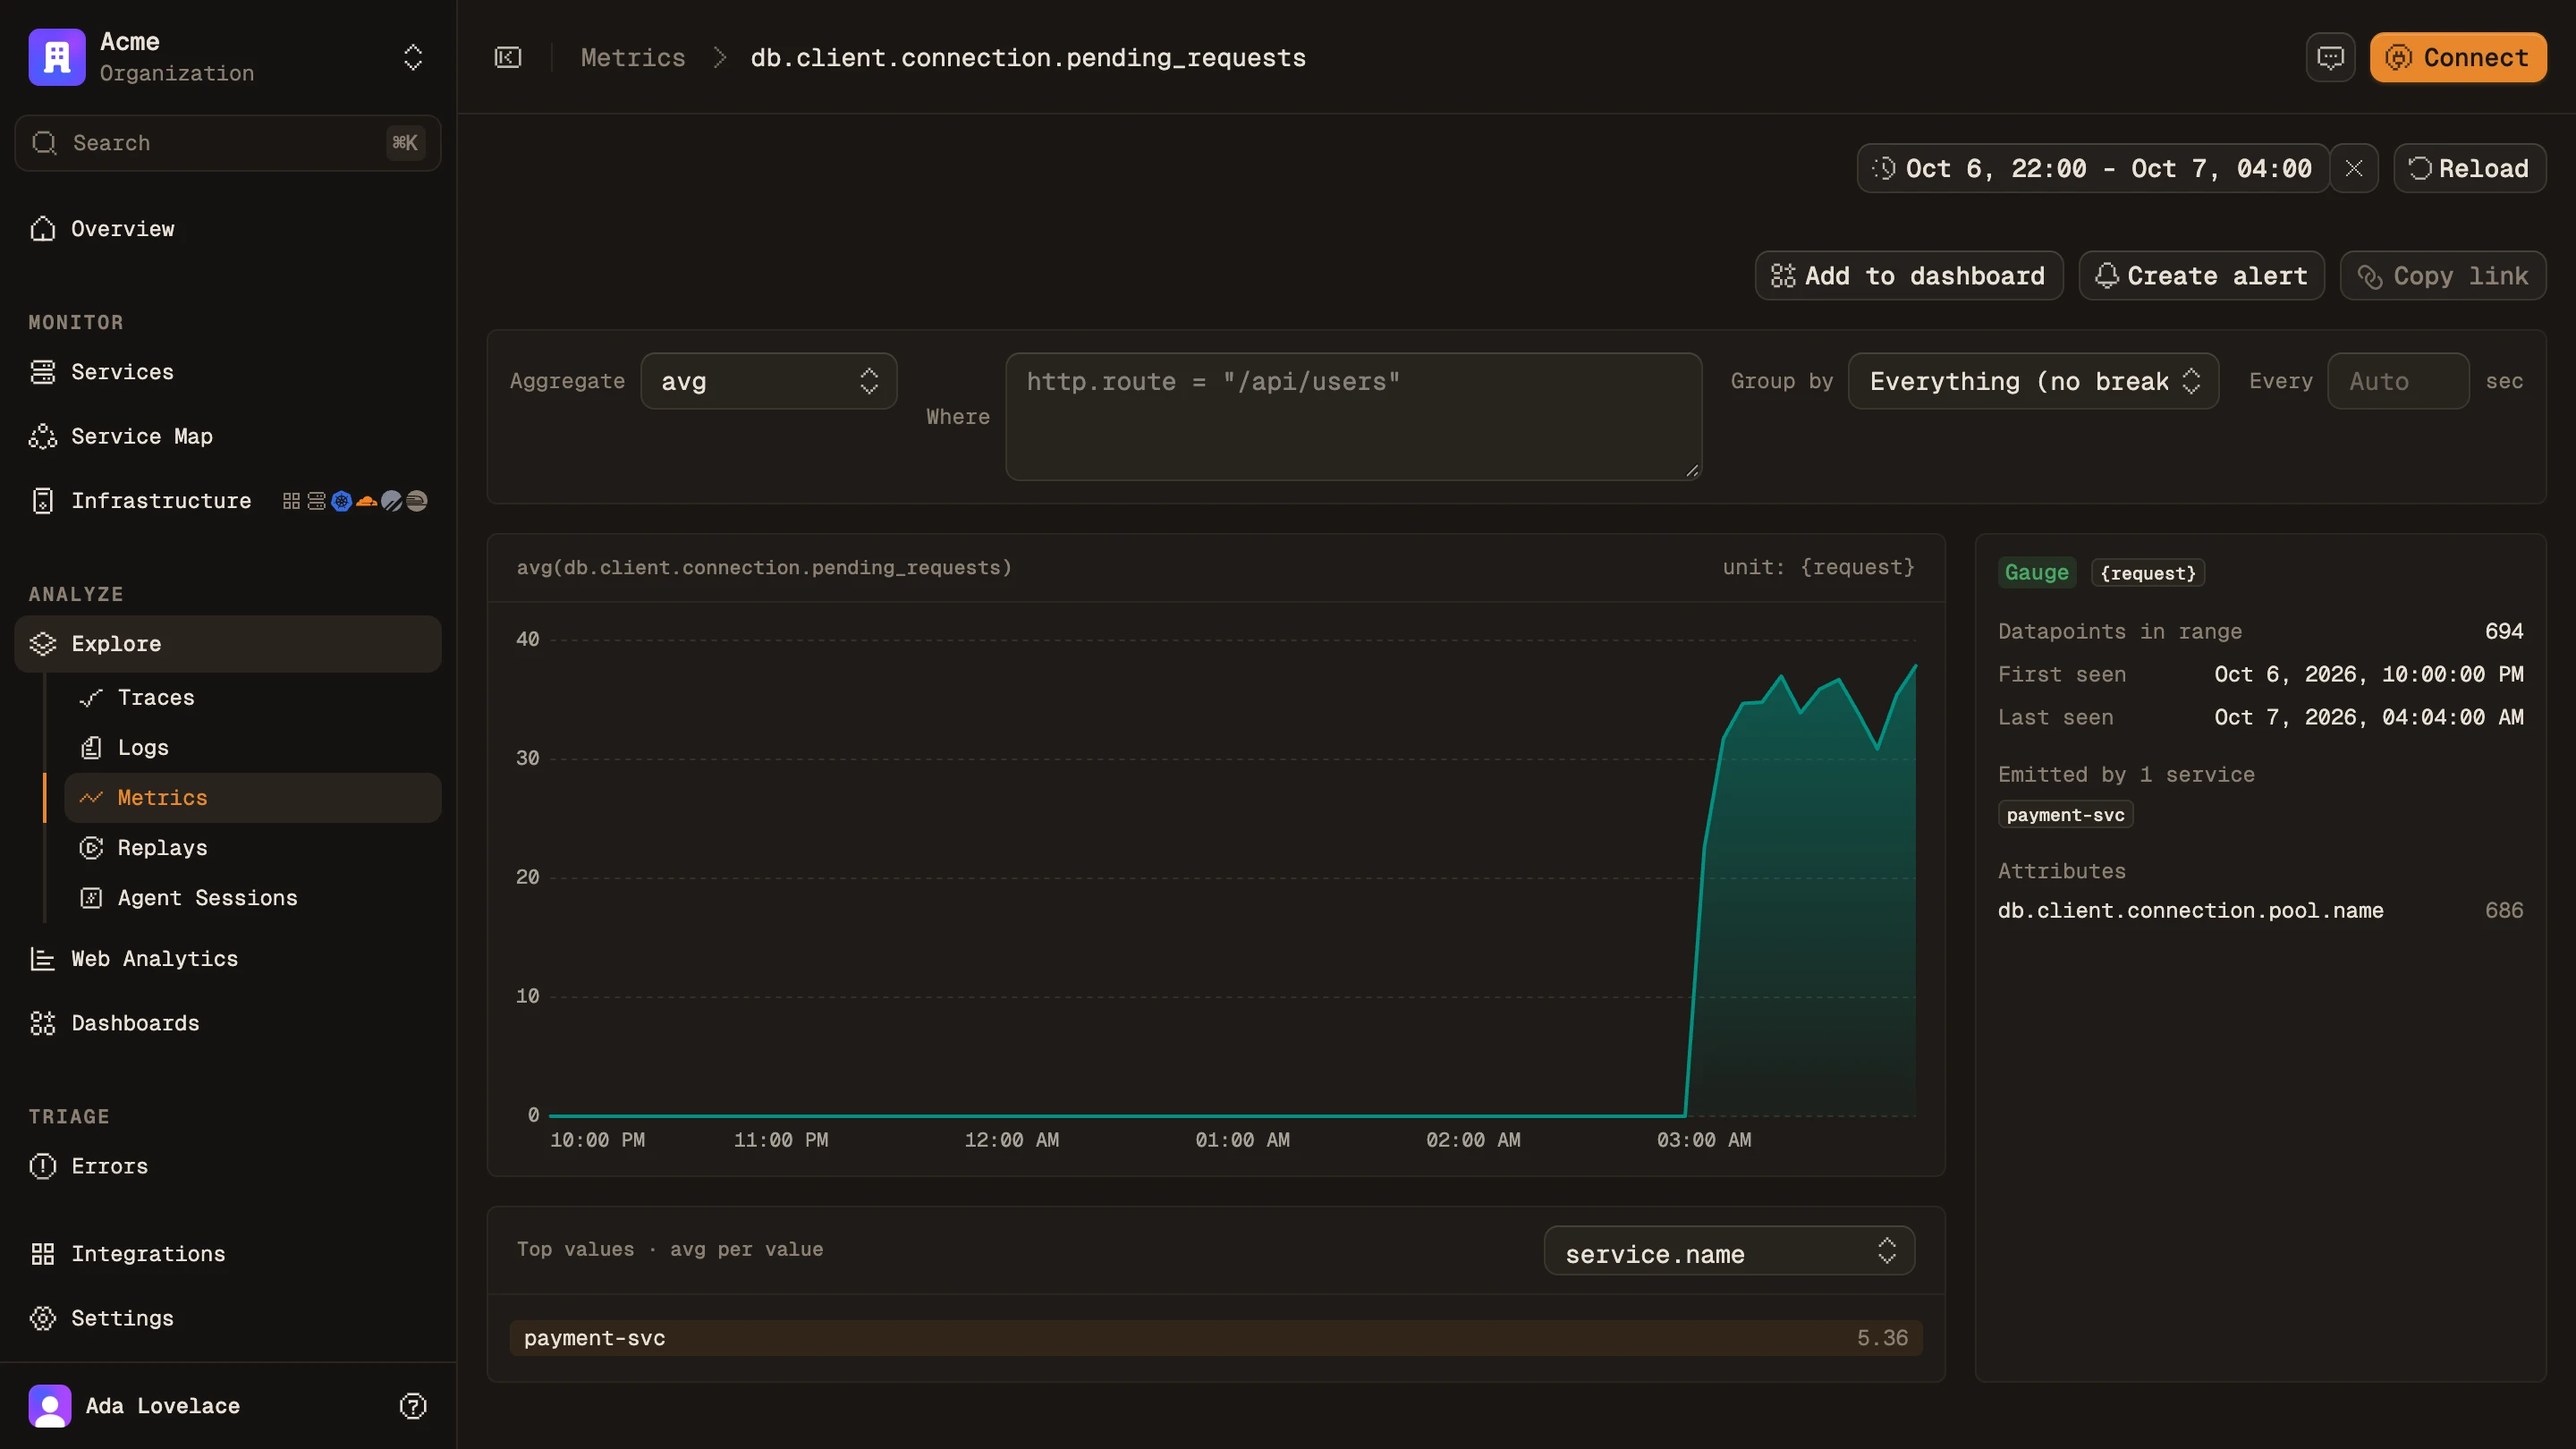
/metrics/:name Requests waiting on the pool
db.client.connection.pending_requests for payment-svc: zero until the deploy, then 30 to 40 requests waiting for a connection
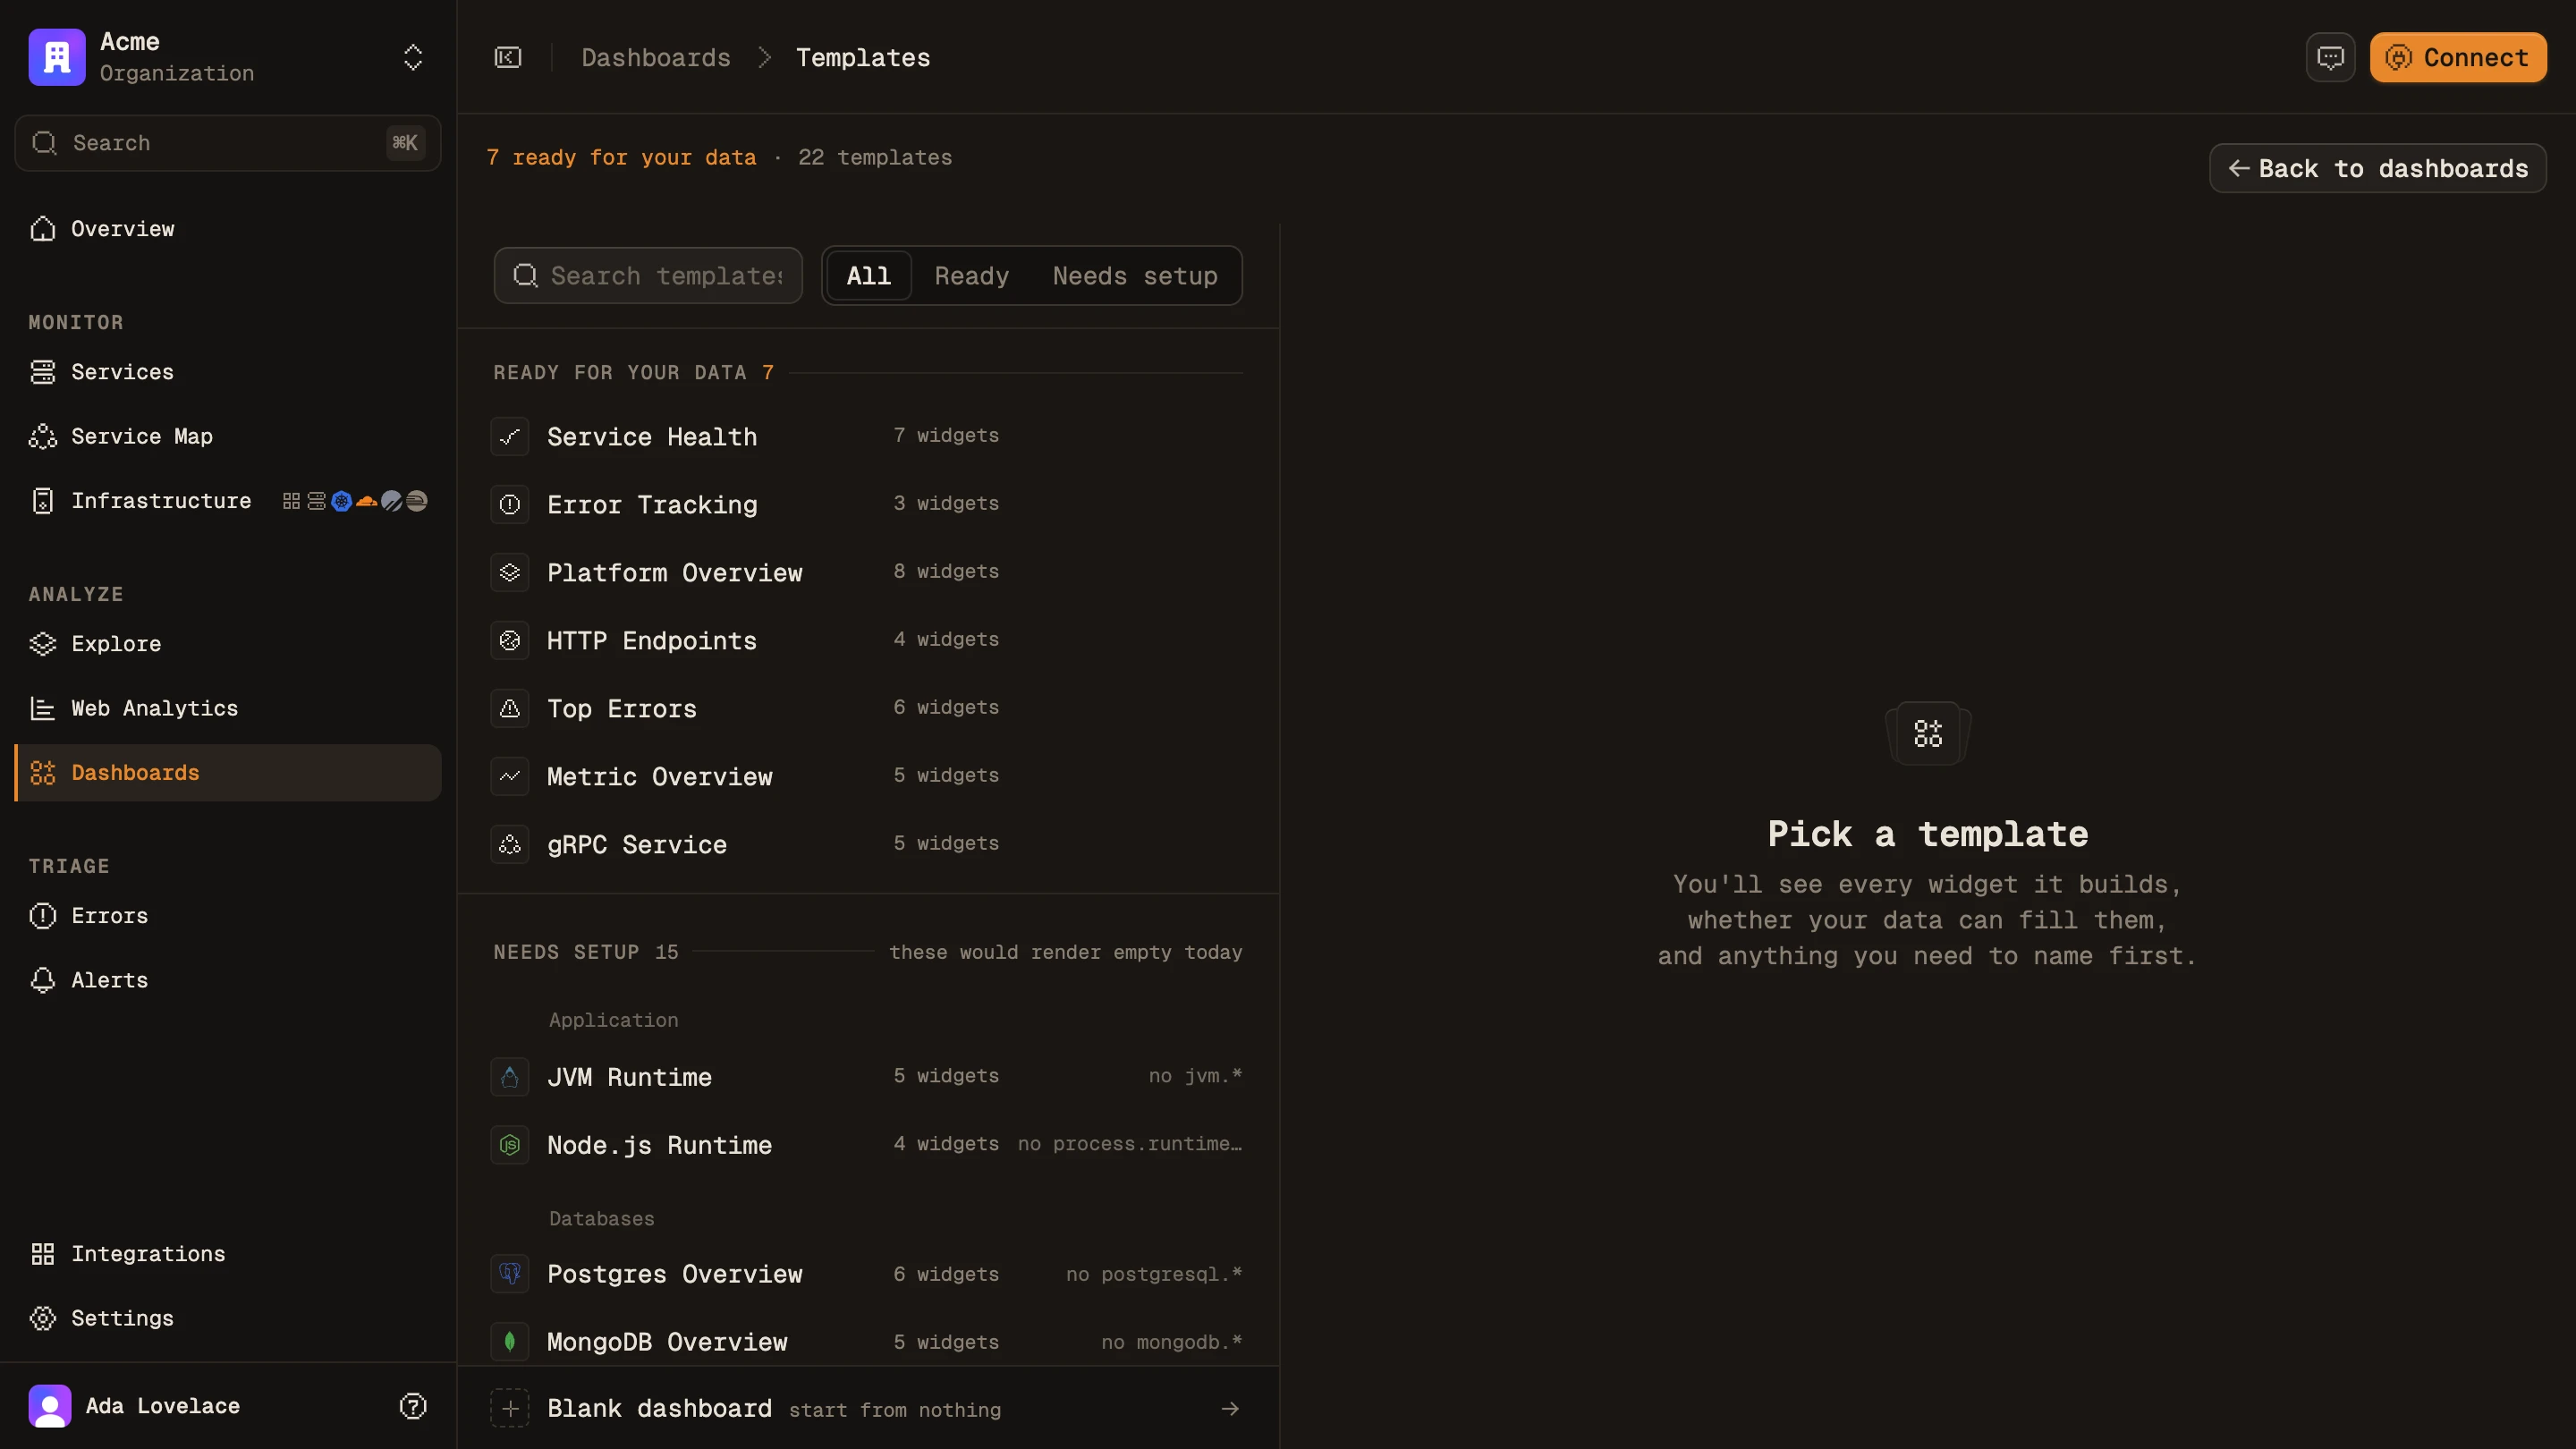
/dashboards/templates Templates your data supports
Dashboard templates sorted by which ones the incoming telemetry can fill

What it does

Build a dashboard

time series
Time series
p50, p95 and p99 on one chart, in the same colors everywhere in the product.
stat + threshold
Stat and threshold
One number and the line it should stay under, like error rate against its budget.
$service
Variables
Add $service or $env once and every chart follows it. One dashboard instead of twelve.
group by
Attribute autocomplete
Group-by suggests only attributes the metric really has, so charts never come up empty.
select range
Chart to trace
Select a time range on any latency chart to see the traces inside it.

Keep going

Related features

Point OTLP at Maple.

One endpoint, one key. Traces, logs, metrics and sessions, linked from the first request.