Use Cases

The p99 moved. Find out which release moved it.

When an SLO breaches, you want the release that caused it. Here that takes three screens, from the alert to the commit, all on the same time range.

signal checkout p99 380 ms · threshold 200 ms

The path

Threshold to commit, in three minutes

The SLO is checkout p99 at or under 200 ms. Each screen below is filtered to the window where it was breached.

  1. alert T+0:00 · slo checkout p99 ≤ 200 ms

    The alert states the breach

    The rule is written against the SLO, so the notification carries the threshold, the observed value and the evaluation window. 380 ms against 200 ms, sustained across three windows.
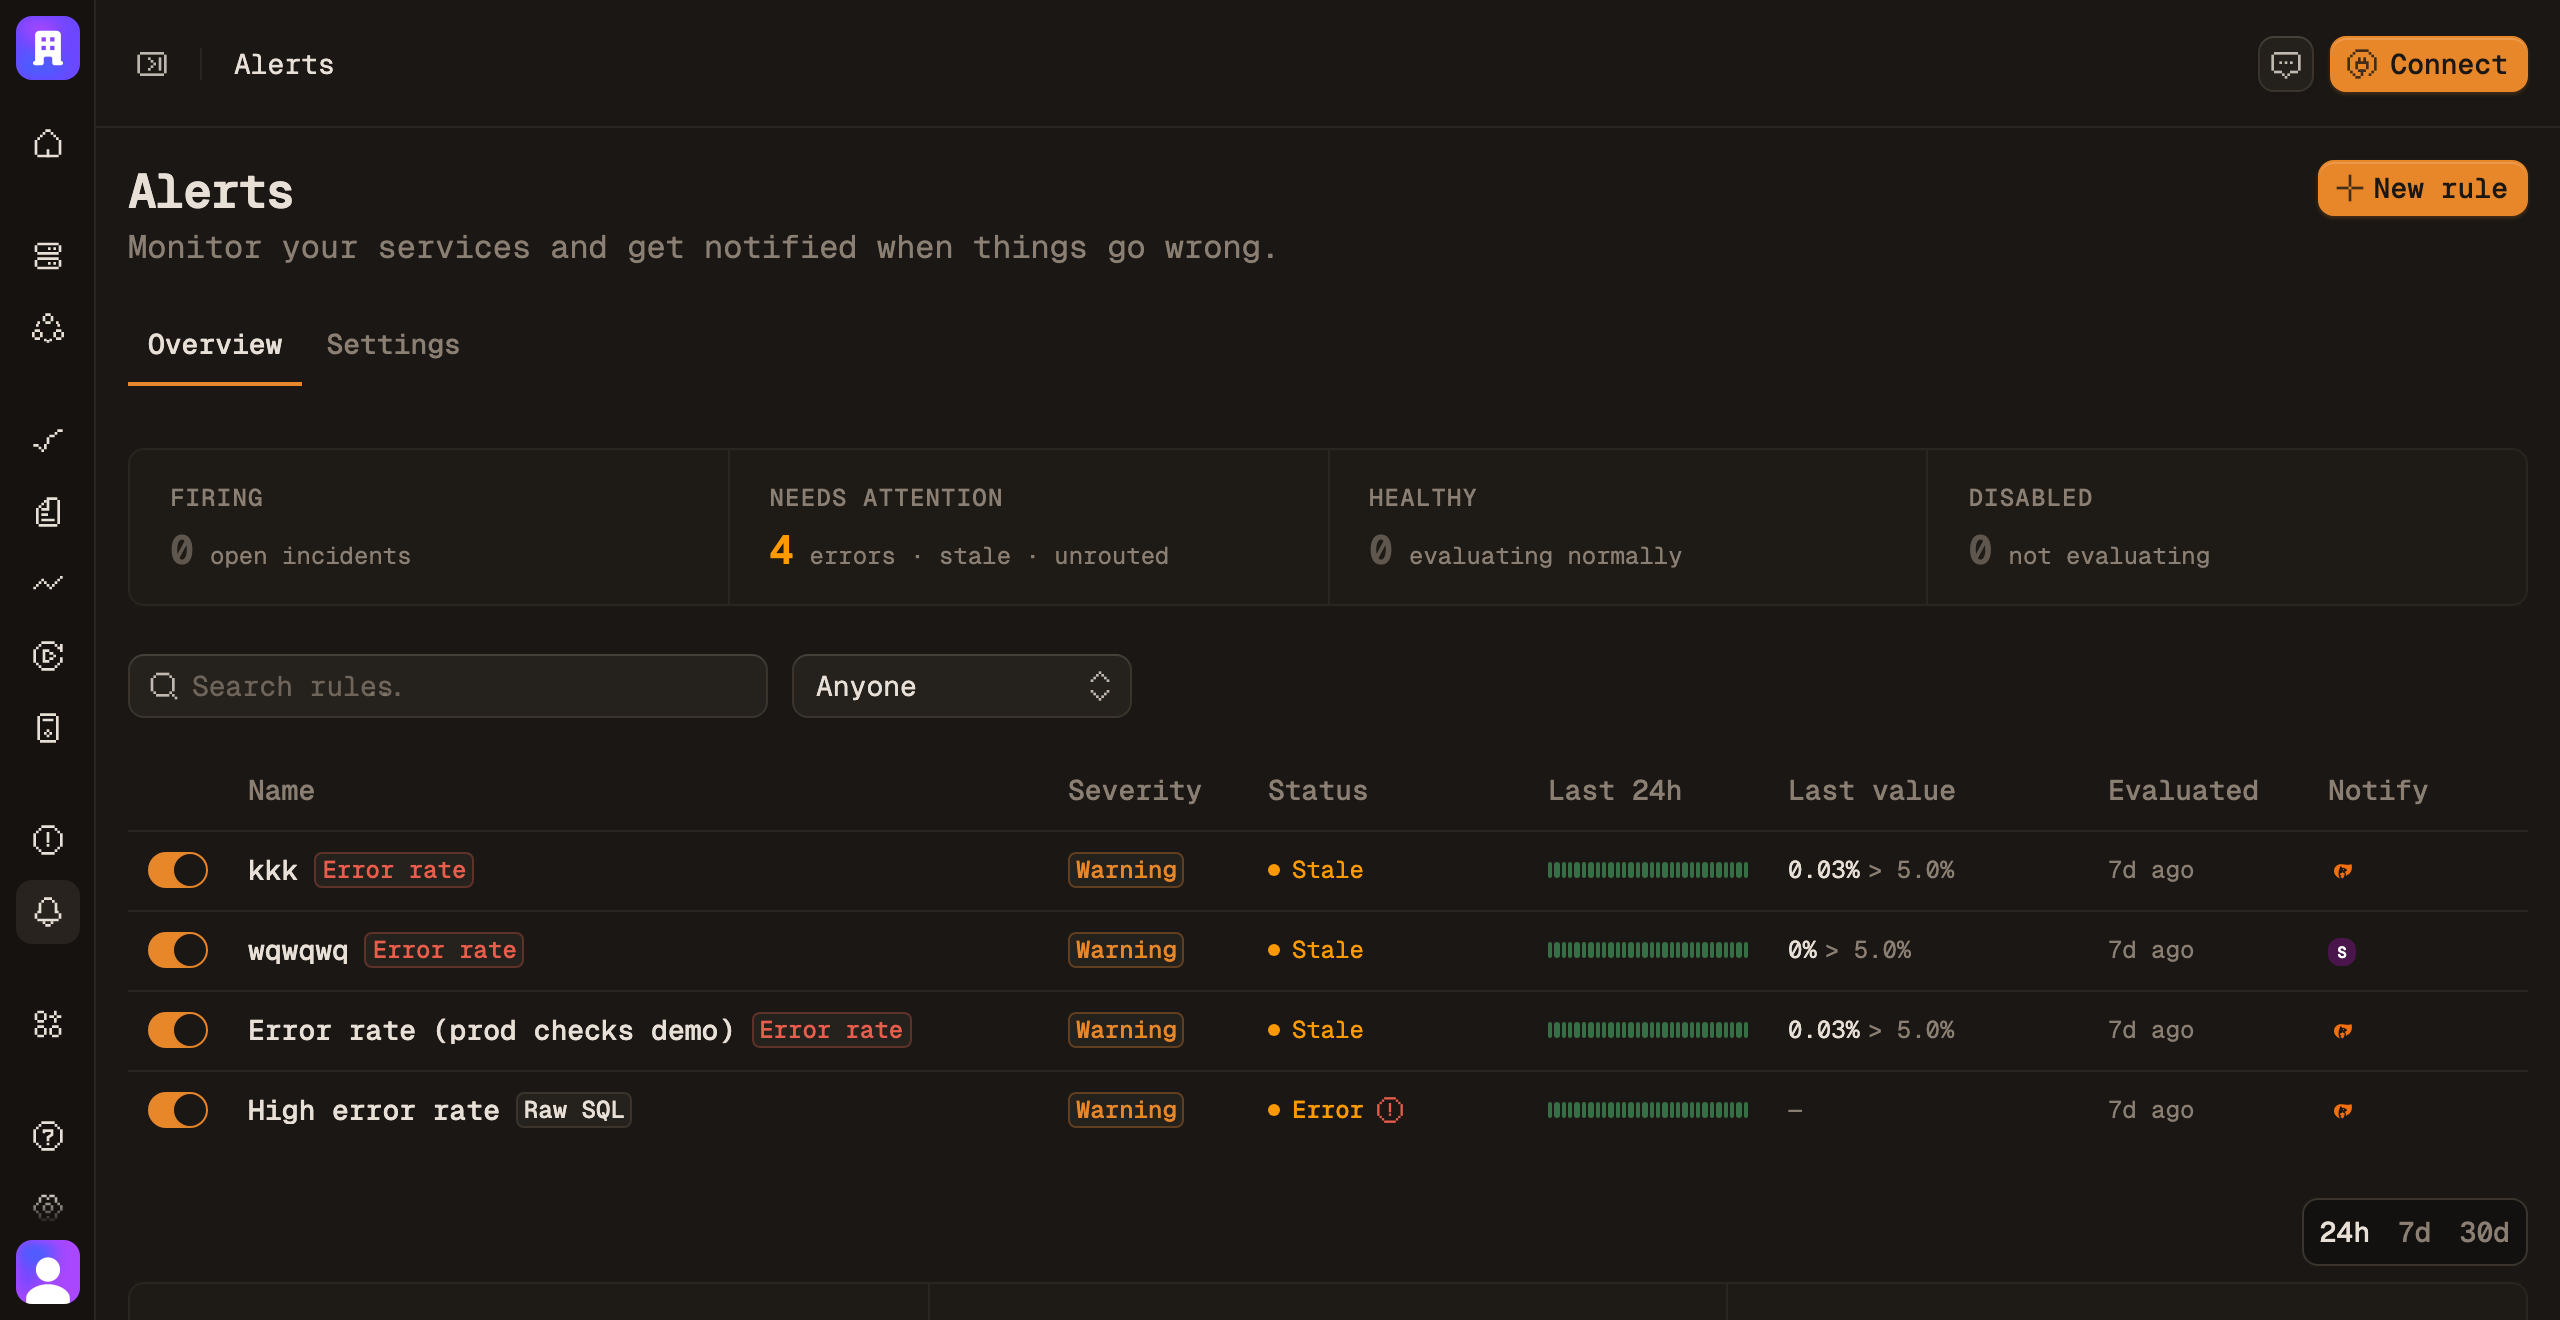
    Alert rules listed with severity, signal type and current state
  2. dashboard T+0:40 · slo checkout p99 ≤ 200 ms

    The dashboard narrows it to one endpoint

    p50 has not moved. p99 has. If the whole service were slow, p50 would move too, so the problem is one route. The route breakdown shows which: POST /checkout.
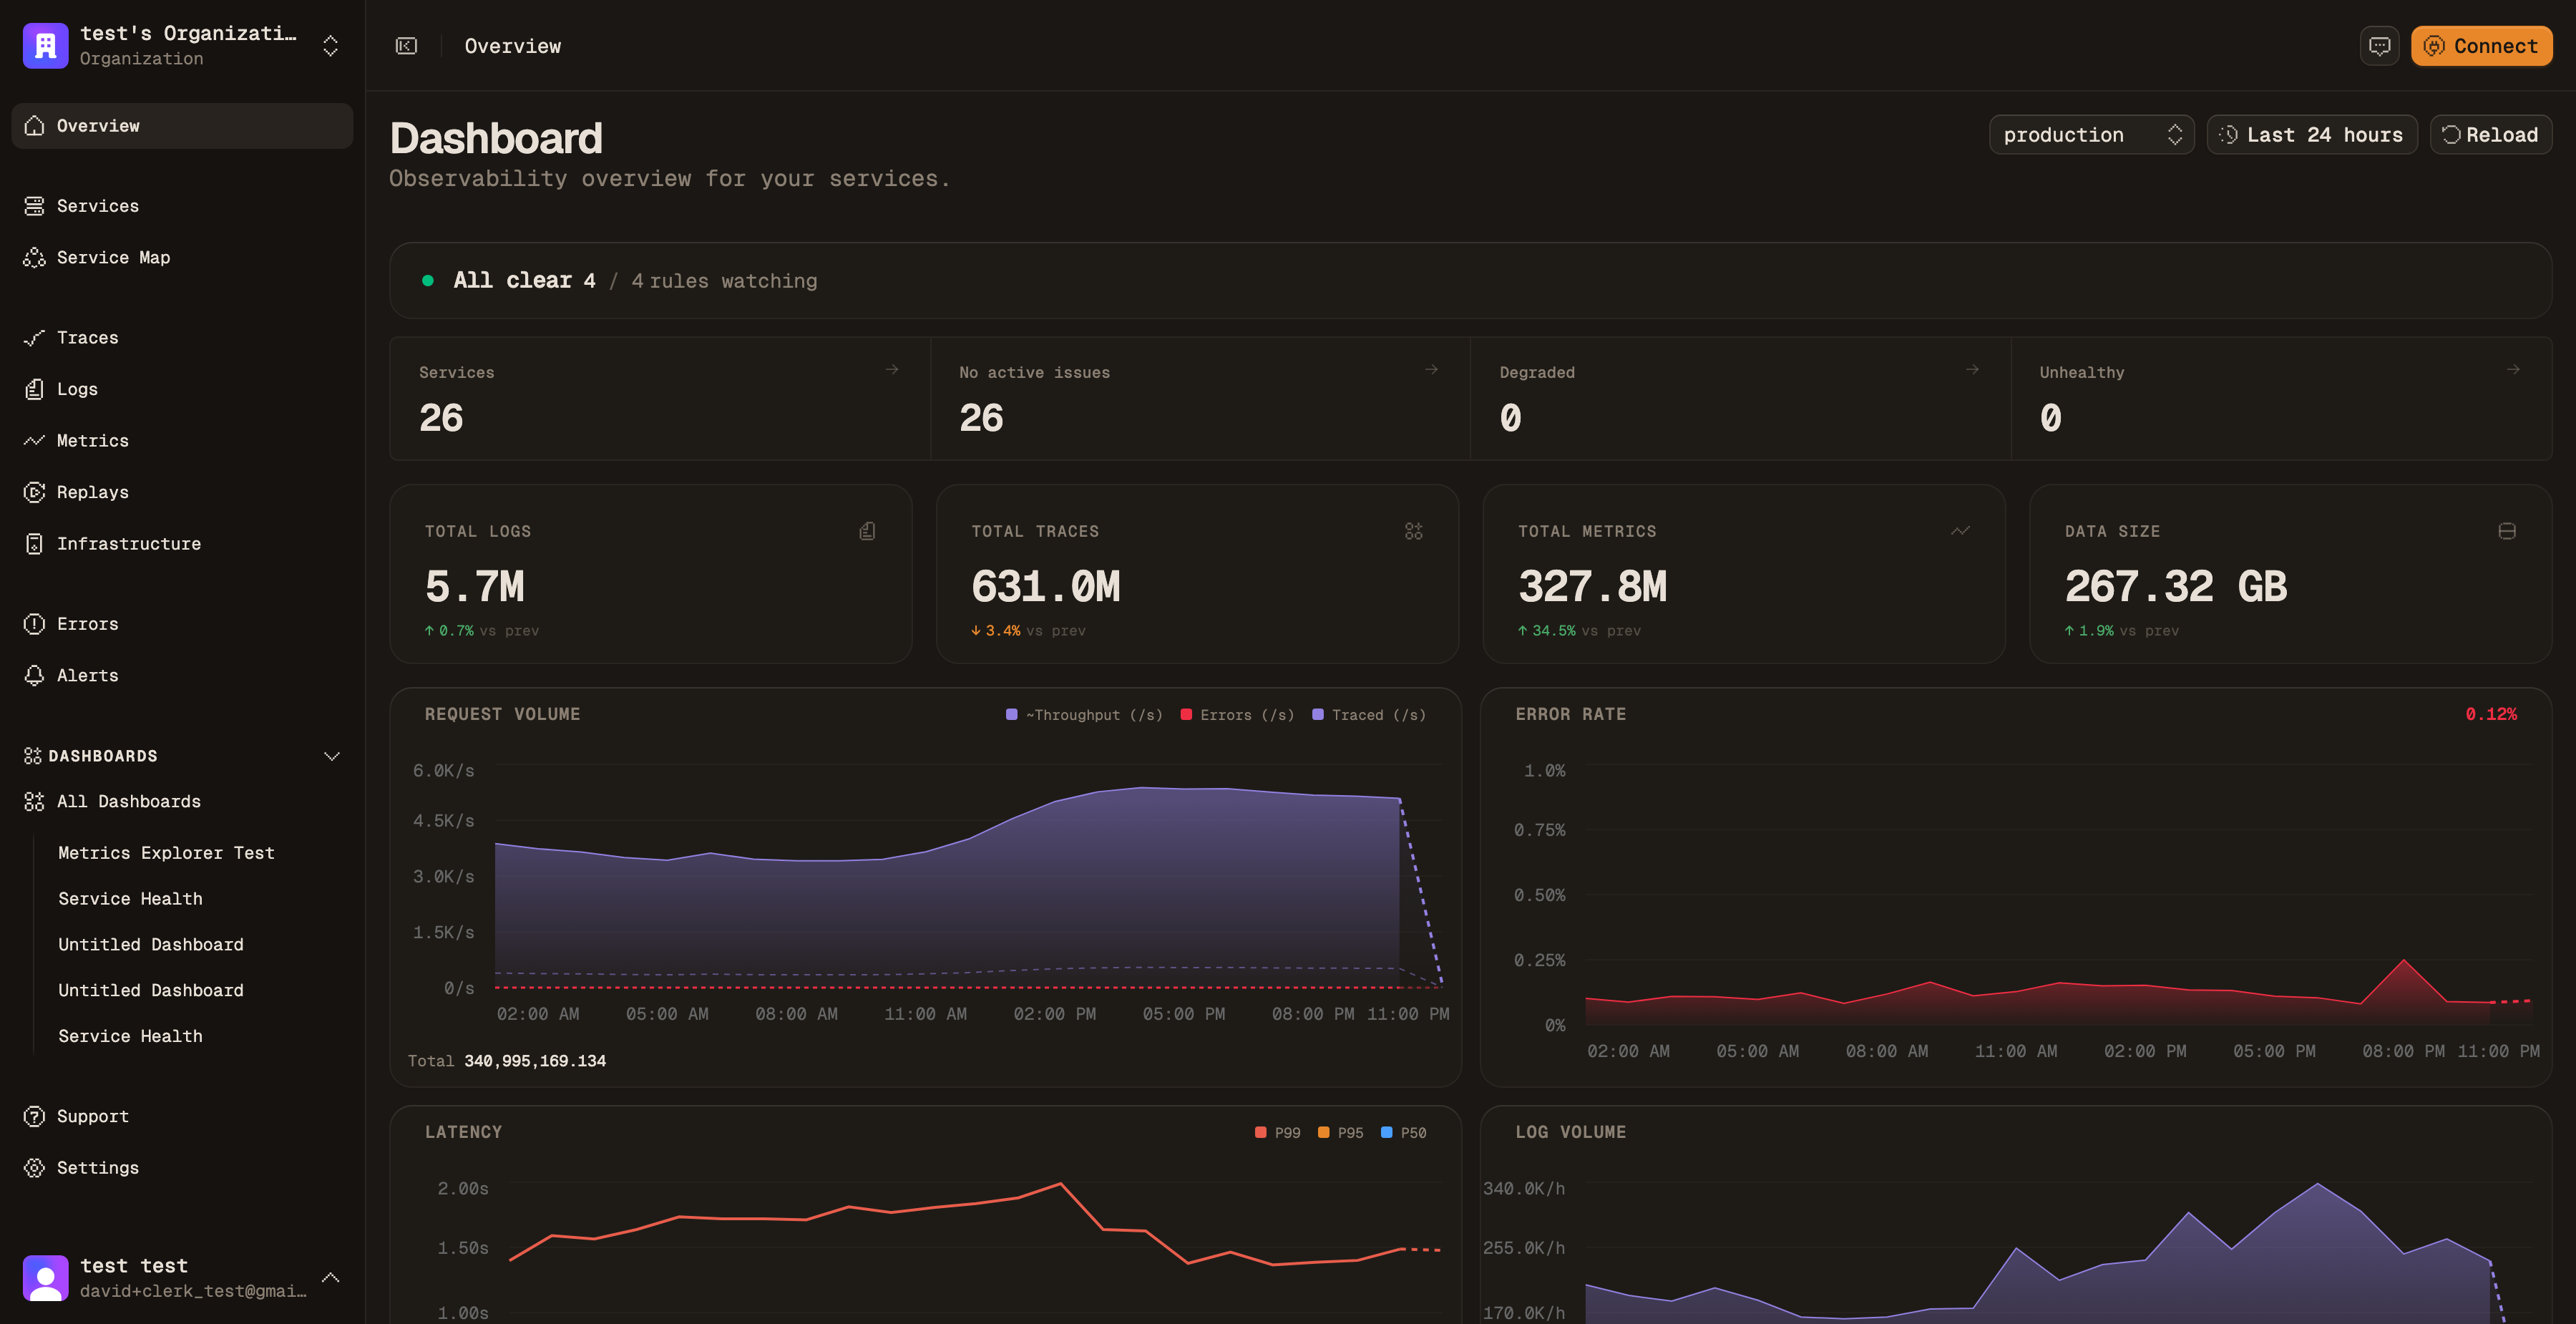
    The overview dashboard with request volume, error rate, latency and log volume charts
  3. releases T+3:15 · slo checkout p99 ≤ 200 ms

    Two releases, side by side

    Split the same endpoint by service.version: p99 is 120 ms on abc123 and 380 ms on def456. Traces under def456 have 50 db.query spans where the earlier ones have 3.
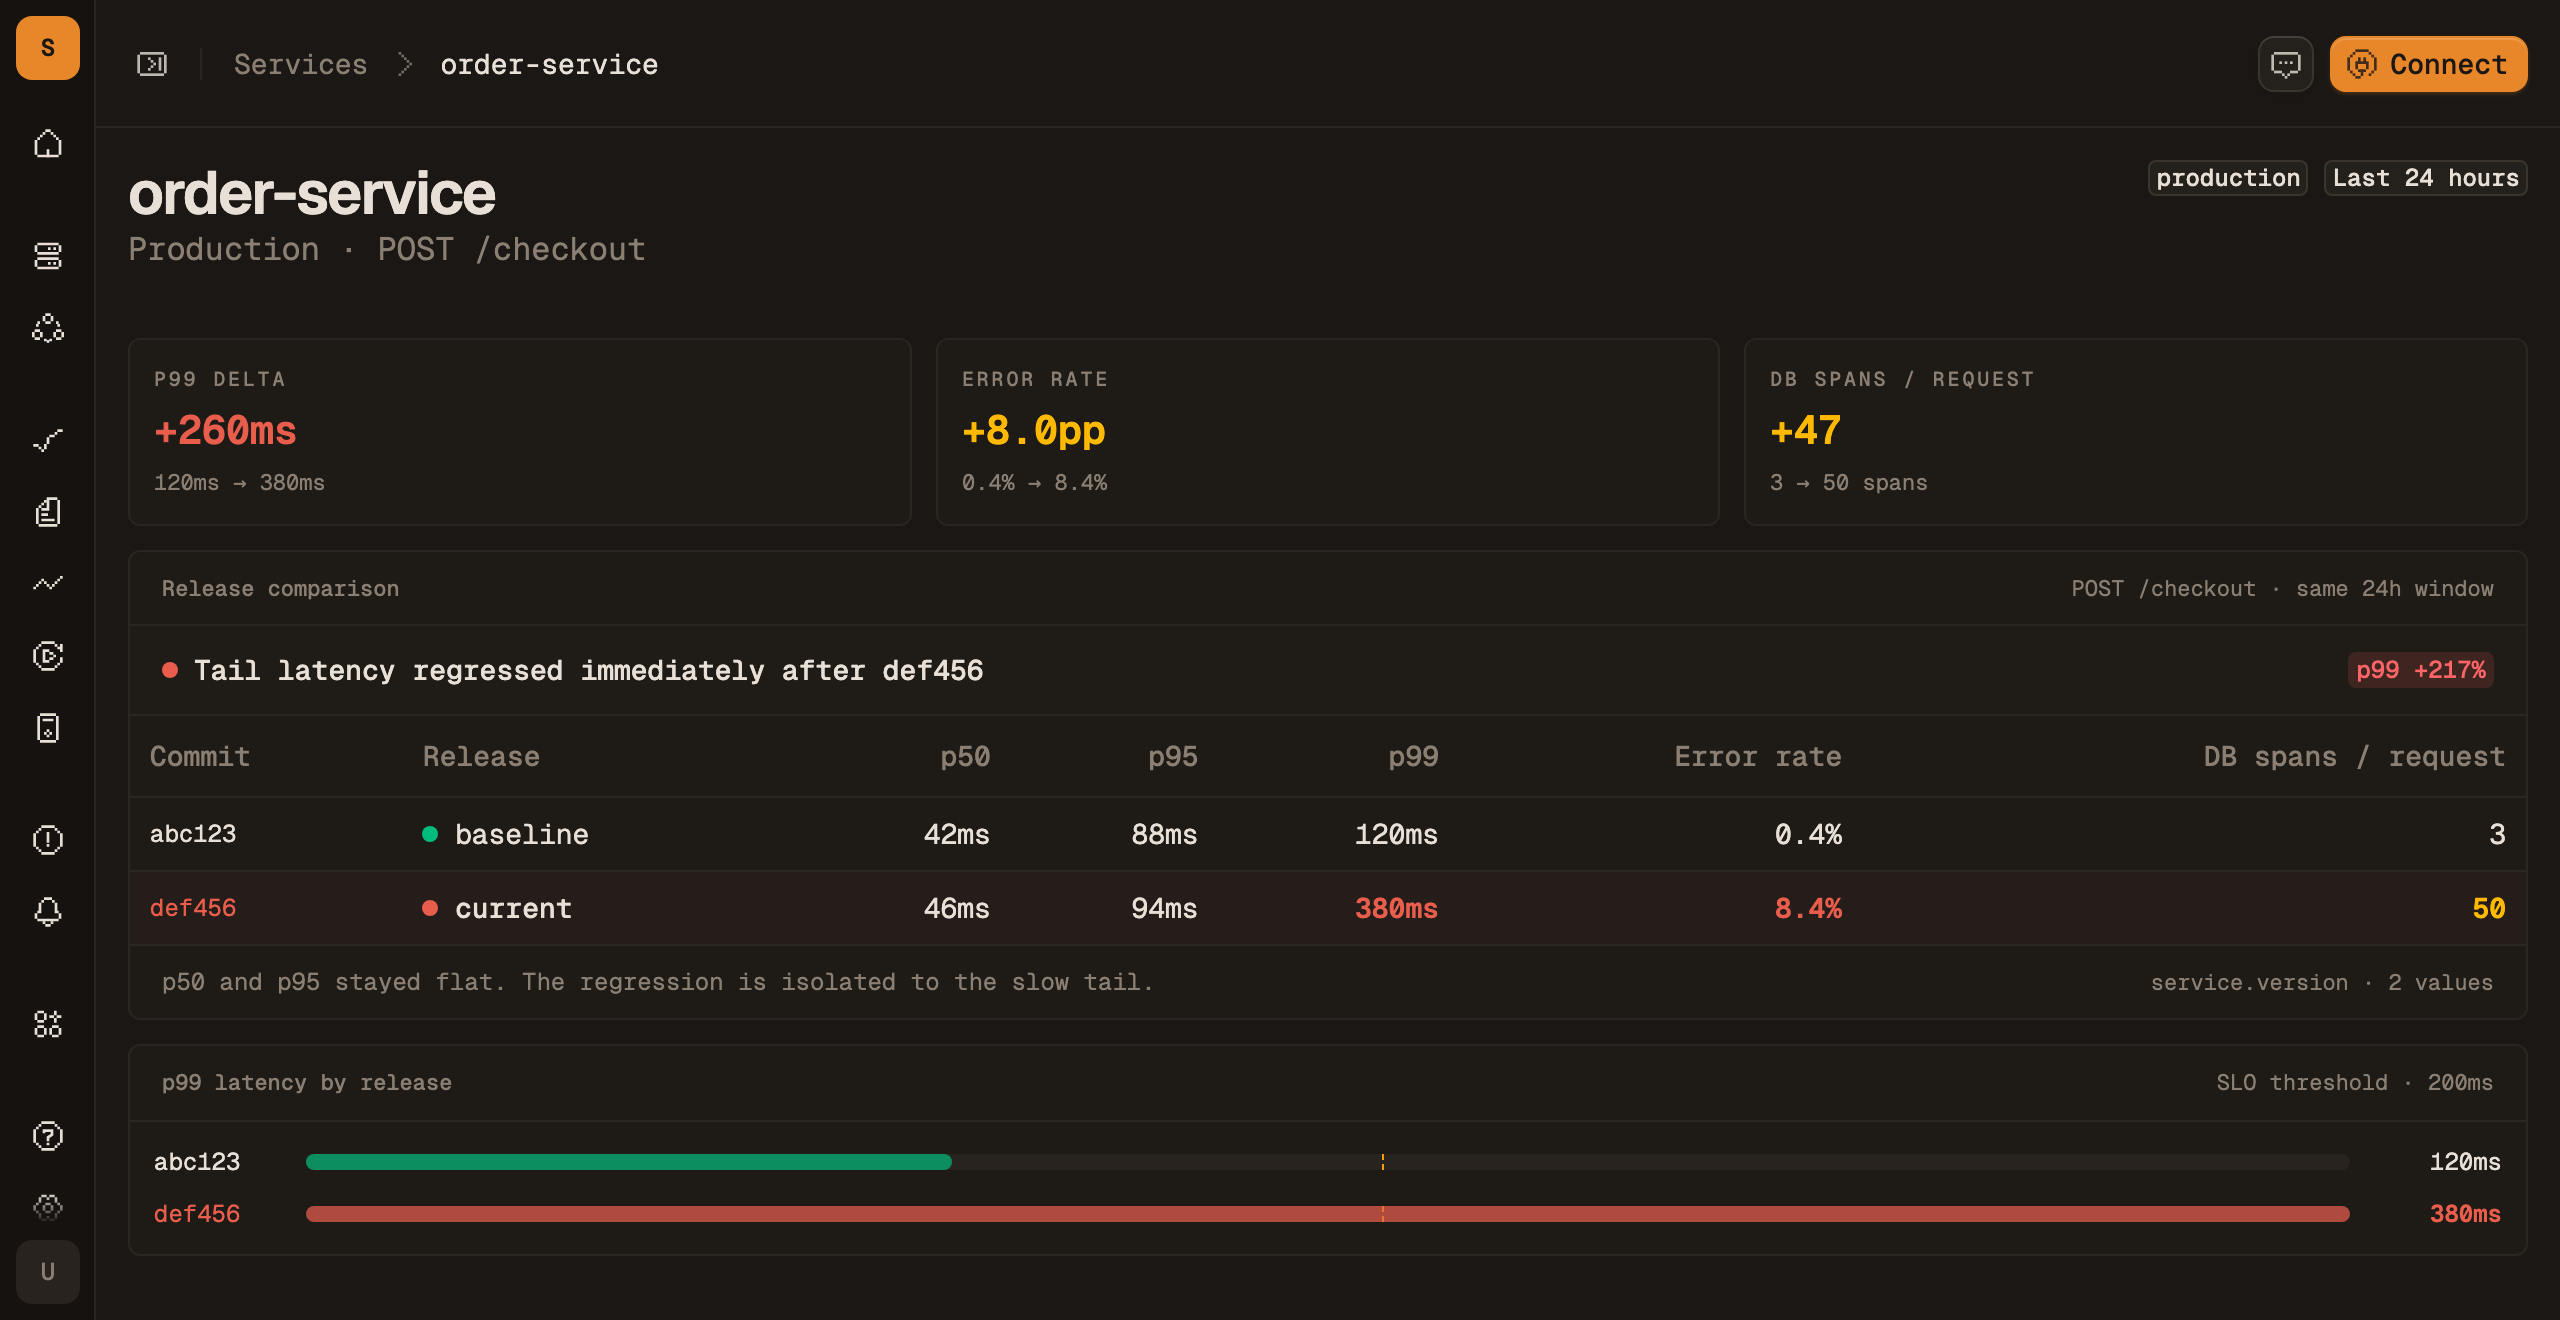
    Two releases of one endpoint compared on p50, p95, p99 and error rate

outcome

Reverted def456 at T+9:20. p99 back under the threshold on the next evaluation window.

9 min
alert to revert
120 → 380 ms
p99, before and after
3 → 50
db spans per request

What it does

Why it took three minutes

p99 > 200ms
The alert knows its own SLO
Rules are written against a percentile and a threshold, so the notification already says how far over the line you are.
service.version
Version is an attribute you can filter on
service.version rides on every span the SDK sends. Comparing two releases is a group-by.
select range
The percentile keeps its traces
p99 is computed from spans that are still stored. Select the spike on the chart and you get the requests inside it.

Keep going

The same data, other jobs

Point OTLP at Maple.

One endpoint, one key. Traces, logs, metrics and sessions, linked from the first request.